Risks in financial markets, including derivative markets, are being regulated by private parties. There is nothing involved in federal regulation per se which makes it superior to market regulation.
– Alan Greenspan
Once it became clear that America’s largest remaining financial firms and investment banks could very well melt down in September 2008, John McCain dropped his red moral hazard flag and raced back to Washington, DC to help push TARP up over that ridge and lead it down to the shore so that a new taxpayer-funded lifeline could be thrown to Wall Street’s drowning titans.
Kevin Hassett had failed upward and was now a top economic advisor to McCain’s presidential campaign.1 A brief rescan of Dow 36,000 didn’t turn up the page on which he and Glassman predicted that the survival America’s largest public financial companies would boil down to massive taxpayer-funded bailouts.
The initial attempt to get the Troubled Asset Relief Program – a plan hastily drawn up by Paulson’s Treasury Department to allow the government buy $700 billion worth of “toxic assets” from troubled banks – failed to pass Congress. President Bush, John McCain, Barack Obama and many other prominent politicians all backed the bill, yet about two-thirds of GOP congressmembers voted “nay” and ~40% of House Democrats gave the measure a thumbs down, yielding a 228-205 defeat.2
President Bush immediately responded with a primetime TV address in which he pleaded for TARP’s swift passage. With the help of backroom arm-twisting, and under the threat of biblical-scale devastation if any trace of Hooverian laissez-faire remained, a second vote took place on October third. This time TARP’s lifeline found its mark. Between the Senate and the House, half of Republican lawmakers and 75% of Democratic lawmakers gave TARP a tepid and begrudged thumbs up.3
Vermont Senator Bernie Sanders was among the prominent “No” votes. Sanders detailed why he made that decision in a long speech on the Senate floor in 2010. He said America had drifted into a system that delivered “socialism for the very rich and rugged free market capitalism for everybody else.”4 That’s an excellent encapsulation of TARP and the context in which it was passed.
It’s impossible to know how Democrats would have responded had they had full control of the federal government in 2008, but it’s a fair bet that they’d have been less favorably inclined towards what was in the interests of top 1% financial firms and their shareholders than the Bush-Cheney administration. An important variant on the “socialist” lifeline that TARP represented would have been to let the flailing mega banks go under in 2008 – just as massive banks failed during the Great Depression – and have the government instead purchase all the home mortgages that were at or near default and have them refinanced at lower, fixed rates so that millions of American families could have simply stayed in their homes. The minnows would have gotten the get out of hock “free” card in such a scenario, not the TBTF whales who fought hard to create the market conditions that allowed the crisis to develop into an epic monstrosity and that were now reaping pure karmic blowback.
Paulson’s Treasury Department briefly considered this option before settling on the direct bank bailout route.5 Those discussions must have contained one of the purest examples of regulatory capture by big business interests in world history. Millions of middleclass and working poor homeowners were cast into the ice-cold waters of debt and foreclosure in 2008 and in 2009 as a result of what the federal government chose not to do as it sifted through its crisis options in late 2008.6 TARP’s lifeline hit the #unholyunion’s mark and nobody else’s mark.
The average American rejected TARP from day one.7 The Tea Party and Occupy Wall Street movements exploded in popularity as soon as TARP’s keg was tapped. What do you call usurious fraud that’s magnified a thousandfold and permitted by a governance superstructure that turns around, once that fraud is exposed, and sticks everyone and every business except the parties that cooked up and committed the fraud with the cleanup expense? The monstrous hypocrisy and immorality embedded in TARP is what animated the Tea Party and Occupy Wall Street movements.
Most 401(k) and retirement plan participants suffered losses of >30% in 2008.8 The NYSE closed 2008 around 5,750, down more than a third compared to the prior year’s close. The S&P 500 tumbled 40% in 2008. How many Americans hit the trickle-down economics trifecta in 2008-09 by losing their jobs, losing >30% of their retirement nest eggs, and losing their home to foreclosure? About a quarter of U.S. subprime mortgages were “seriously delinquent” by early 2009.
A billionaire investor by the name of Jim Rogers stood up and seconded Sanders’ assessment of TARP. Rogers called the Treasury Department of late 2008 “more communist than China…This is welfare for the rich.”9 Yes, of course it was. TARP and its analogs were socialist but a version of socialism that overwhelmingly helped top 1% firms and top 1% families escape the frigid waters of the North Atlantic.
TARP was trickle-down socialism. How surprising is that result given that Paulson was formerly the CEO of Goldman Sachs who cashed out ~$600 million in company stock before becoming Treasury Secretary in 2006? Paulson embodied the corporate takeover of the #unholyunion and completely internalized the regulatory capture ethos. The fox was running the henhouse.
Here’s how the initial $175 billion in TARP funds were allocated among America’s TBTF financial firms:10
- Bank of America – $45 billion
- Bank of NY Mellon – $3 billion
- Citigroup – $45 billion
- Goldman Sachs – $10 billion
- JPMorgan Chase – $25 billion
- Merrill Lynch – $10 billion (this went to BofA per a subsequent buyout)
- Morgan Stanley – $10 billion
- State Street – $2 billion
- Wells Fargo – $25 billion
Alan Greenspan, the man who’d led the Fed from the Reagan administration to early 2006, was called to testify before Congress a little before Halloween 2008. There, he was asked if his decades long push to deregulate financial services and to trust that big financial firms would self-regulate their activities had been wise. The octogenarian slid onto that old rusty sword of his.
“Those of us who have looked to the self-interest of lending institutions to protect shareholder’s equity – myself especially – are in a state of shocked disbelief,” responded Greenspan. “The problem here is something which looked to be a very solid edifice, and, indeed, a critical pillar to market competition and free markets, did break down. And I think that, as I said, shocked me. I still do not fully understand why it happened and, obviously, to the extent that I figure out what happened, and why, I will change my views.”11
Henry Waxman, a House member from California, pressed on, unsatisfied with the amount of mea culpa flesh extracted:12
Waxman: The question I have for you is, you had an ideology, you had a belief that free, competitive — and this is your statement — “I do have an ideology. My judgment is that free, competitive markets are by far the unrivalled way to organize economies. We have tried regulation, none meaningfully worked.” That was your quote. You had the authority to prevent irresponsible lending practices that led to the subprime mortgage crisis. You were advised to do so by many others. And now our whole economy is paying the price. Do you feel that your ideology pushed you to make decisions that you wish you had not made?
Greenspan: …To exist, you need an ideology. The question is, whether it is accurate or not. What I am saying to you is, yes, I found a flaw, I don’t know how significant or permanent it is, but I have been very distressed by that fact.
Waxman: You found a flaw?
Greenspan: I found a flaw in the model that I perceived is the critical functioning structure that defines how the world works, so to speak…I was shocked, because I had been going for 40 years or more with very considerable evidence that it was working exceptionally well.
Greenspan, in the end, had enough integrity to acknowledge that the laissez-faire libertarian ideology was fundamentally flawed. It’s alleged free lunch had come to a crashing end, and at least he saw that – after his hands were off the levers of power, of course.
Anna Schwartz, herself 92, did her best to channel Milton Friedman once the full scope of America’s economic crisis became clear. In an interview in The Irish Times three days after TARP’s passage, Schwartz said that “…I’m sure that if Milton were alive, he would be writing about the shortcomings of this Fed, and it would have a tremendous impact on the market and might even persuade the present leadership to abandon the kinds of policies that they’ve instituted.”13 Hold up. Friedman and Sanders would have agreed that TARP was terrible policy, right?
“Rescuing firms that are on the verge of bankruptcy is contrary to the way capitalism is supposed to operate,” Schwartz elaborated, “And their fear tactic of the downside warning that a recession will be on the way unless they take action, warning that the market won’t be able to respond to the elimination of firms that aren’t able to meet the market tests, I think these are all doctrines that have no basis either in the behaviour of other central banks or that are supported by the Fed’s own history.”14 Got it. The literal authors of monetarism wanted the U.S. government to let all those TBTF banks implode. #feelthebern.
Schwartz added that LTCM’s bailout in the preceding decade set a bad precedent. “The Fed’s approach is there will be a crisis if you don’t rescue a failing firm,” she said. “And that’s not true. The market knows when a firm isn’t sound. And if the Fed didn’t behave as if every failing firm is too big to fail, then it would permit the exit of firms that weren’t really viable and the market would recognise this as a just decision. It’s not the job of the Fed to be intervening to help such firms.”15
The mere existence of TBTF companies and the reality of TARP’s gushing keg demonstrated that, when the chips were down in America in 2008, big business is big government and big government is big business. That’s the unassailable truth of what played out in 2008-09. The alleged front line between big government and big business, two forces that Americans have been told for decades have been engaged in some kind of zero-sum MMA cage match by #trickledownfaithful zealots, instead turned out to be a mutual love-in by the kiddy pool. Mi casa es su casa, comrade. That’s the hypocrisy, that’s the immorality that TARP embodied.
A 2009 Rasmussen poll found that 55% of Americans wanted the government to let #TBTF banks go under, and 43% wanted those banks smashed up, a la the Standard Oil Trust.16 The American people never wanted TARP and even the most lily-white l-f-lib ideologues opposed TARP, but it happened. What does that tell you about who wore the pants in the U.S. government in 2008?
USCC and AEI humdingers climbed out of their foxholes to run cover for the big banks in this timeframe. The think tanks and lobbying firms that are wholly owned subsidiaries of the l-f-lib wing of the big business community served up some classic “let’s not rush to judgment on TARP” gibberish circa 2009.17
Friedman’s ghost refused to pull its punches. If the Fed and Treasury kept getting “into the business of rescuing every failing firm,” Anna Schwartz warned, “we won’t have a capitalist system.”18 The USCC and AEI were over at the kiddy pool, meanwhile, giving Paulson and Bernanke some vigorous blowies.
A side-effect of the massive pressure changes unleashed by the bursting of America’s speculative financial bubble in late 2008 was that daylight appeared between the two halves of the #unholyunion for the first time in decades. For a brief moment in the middle of the shitstorm, Bernie Sanders and Milton Freidman’s ghost clasped hands, but both wound up with the short end of the real-world policy stick.
♦
Technically, the Great Recession started in late 2007 and ended in mid-2009. Knock-on effects, though, lingered through at least 2014. The U.S. economy shrank four consecutive quarters in a row, a very rare historical occurrence. 4Q 2008’s GDP, -8.4%, was the worst such result since the Great Depression.19 By the end of ‘08, the Fed had spent $1.2 trillion buying “toxic assets” from big banks, and had made other emergency (often secretive) loans to these same institutions, insurance companies, credit card providers and other big businesses.20
The newly elected president, Barack Obama, ordered Congress to look into the causes of the disaster.21 The Financial Crisis Inquiry Commission (FCIC) reported back in 2011. The bicameral, bipartisan commission found that the crisis was the result of:22
- A widespread failure of financial regulation and supervision that proved devastating to the nation’s financial markets
- Dramatic failures of corporate governance and risk management at many systemically important financial institutions
- A combination of excessive borrowing, risky investments, and lack of transparency that put the financial system on a collision course with crisis
- A government that was ill-prepared for the crisis, and inconsistent responses added to the uncertainty and panic in financial markets
- A systemic breakdown in accountability and ethics
- A collapse in mortgage-lending standards and a mortgage securitization pipeline that lit and spread the flame of contagion and crisis
- The rapid ascent in over-the-counter derivatives trading, and
- The failures of credit rating agencies, which proved to be key cogs in the wheel of financial destruction.
That about covers it.
Paul McCulley, the managing director of PIMCO, an investment management firm that specializes in fixed income investments, wrote a mid-2009 article that underscored the connection between the crisis and the deregulation of U.S. financial markets. McCulley observed that America had been on a “Minsky journey – a bubble in asset and debt prices – as the marginal unit of debt creation morphed from hedge to speculative to Ponzi…”23 It was high time that policymakers acknowledged, McCulley added, “that we are where we are because they let the invisible, if not crooked, hand of financial capitalism go precisely where Professor Minsky said it would go, unless checked by the visible fist of counter-cyclical, rather than pro-cyclical, regulatory policy.”24 McCulley effectively presaged what the FCIC later concluded had induced the crisis.
Federal policy had helped pour fuel on big finance’s speculative, and later, Ponzi growth scheme blaze for years if not decades before the crisis. It had been deregulation that gave big finance the “market freedom” it needed to create a very efficient near-term profit engine that got jammed after its built-in scam was uncovered, and then that engine started running in reverse in 2008. The successive watering of federal regulations in financial services wound up exacerbating the financial market’s penchant for generating boom and bust cycles that Minsky had warned about.
In 2012, Ian Stewart, a math professor at Warwick University in England, published In Pursuit of the Unknown: 17 Equations That Changed the World. Stewart observed the book that, although the Black-Scholes equation had “underpinned massive economic growth”, it had also led to a situation, by 2007, in which the “international financial system was trading derivatives valued at one quadrillion dollars per year.”25 Stewart calculated this was ten times the value of the world’s inflation-adjusted manufacturing output over the last century.26 That isn’t big finance, it’s batshit out of control finance.
Given that the Black-Scholes equation was broadly used to justify more speculation rather than used to reduce the risks of limited speculation, Stewart continued, it had become “one ingredient in a rich stew of financial irresponsibility, political ineptitude, perverse incentives and lax regulation” that led to the implosion of several U.S. megabanks and the partial meltdown of many more, as well as the broader social pains that ensued in the U.S. and around the globe.27 Thanks #unholyunion. Your fingerprints and DNA are all over the murder weapon.
In the third quarter of 2013, a trio of economists at Dallas’ Federal Reserve Bank used quarterly data gathered since the disaster to estimate its cumulative costs. The economists found, among other things, that the U.S. government had supported domestic financial institutions to the tune of $12.6 trillion since the crisis started.28 That was significantly higher than most of the figures reported in the news to that point. Much of those resources came in the form of low-interest loans that got paid back in time, but a fair portion of that money was sucked down the deleveraging spiral black hole and disappeared forever.
The Dallas Fed’s middle of the road estimate of America’s output losses (society-wide costs) due to the financial system crisis totaled $11.7 trillion over the 2008-2023 window.29 The economists’ model assumed that, by 2023, America would get back to the GDP growth path it had been on before the crisis. They conceded that the U.S. may suffer a permanent GDP slowdown due to the events of 2007-09, however, and that the nation’s output hit could top $14 trillion by 2023 and keep rising indefinitely.30 Wow, thanks #unholyunion.
That ~$11.7 trillion economywide output hit doesn’t cover the full tab. The Dallas Fed’s economists also wrote that, “Society must deal with the consequences of a swollen federal debt, an expanded Federal Reserve balance sheet and increased regulations and government intervention for years to come.”31 Any costs stemming from these side effects were ignored by the Dallas Fed. Other indirect costs, including the negative consequences of rising inequality (the Gini coefficient for family income rose in this timeframe, as chapter one’s figure two showed), need to be added on top of that total as well.
Speaking of reregulating U.S. financial markets, President Obama signed the Dodd-Frank Wall Street reform package into law in the summer of 2010. That legislation included many logical and badly needed financial system oversight and regulatory reforms, but it fell short of reinserting Glass-Steagall’s firewall between commercial and investment banking.32 Dodd-Frank was more of a partial restoration of what had existed in the late 1990s. The legislation also barely made it over a Senate filibuster because, even after everything that had happened, just three Republicans found it in their hearts to pick up Greenspan’s mea culpa sword and fall on it.33 All other Republican Senators rallied back behind the l-f-lib ideological banner. Nothing to see here. Bigger brooms and rugs for another pile of “bad apples”, please.
From his gilt carriage on the sidelines, Sandy Weill rolled down a window in 2012 to inform us that he’d been wrong about Glass-Steagall after all. That July, he told CNBC’s “Squawk Box”, “What we should probably do is go and split up investment banking from [commercial] banking…”, and he added that TBTF institutions should be downsized “…so that the taxpayer will never be at risk, the depositors won’t be at risk…”, and that the leverage ratios of these institutions, moreover, should be kept <15:1.34 Wow. Thanks, Sandy. You’re two decades late and trillions of dollars short. Whatever happened to that four-foot etching you had made of yourself after you led the charge to smash Glass-Steagall to dust?
The AEI, of course, was still deep in big business’ cash-lined pockets in 2012. A senior fellow there, Peter Wallison, wrote that “…breaking up the largest banks into smaller entities…would be highly disruptive to the economy and the financial system.”35 Aw shucks. We wouldn’t want the economy disrupted, right Pete?
A Rasmussen poll in early 2013 found that Americans, by >2:1 margin, wanted the government to let big banks and other financial companies go out of business if they couldn’t meet their financial obligations.36 The American public never wanted TARP or its kindred policies. Rasmussen additionally found that U.S. adults, by >2:1 margin, preferred “a plan to break up the 12 megabanks, which currently control about 69% of the banking industry” as opposed to letting these entities remain in place.37 If they had to be saved, the American people’s common sense logic went, then at least cut them down to size so that they can’t rebuild their weapons of socioeconomic mass destruction. Get rid of TBTF firms once and for all, then burn the list.
By late ‘13, big finance’s lobbyist and thinktank minions had started to go back on offense. Introduced by Illinois’ Randall Hultgren, the “Swaps Regulatory Improvement Act” attempted to gut a part of the Dodd-Frank reform package that Citigroup and a handful of other TBTF financial behemoths didn’t like.38 As The New York Times put it, “In a sign of Wall Street’s resurgent influence in Washington, Citigroup’s recommendations were reflected in more than 70 lines of the House committee’s 85-line bill. Two crucial paragraphs, prepared by Citigroup in conjunction with other Wall Street banks, were copied nearly word for word. (Lawmakers changed two words to make them plural.)”39
Thanks goodness the GOP-led House was ready, willing and able to again start dotting the i’s and crossing the t’s of whatever Citigroup, JPMorgan Chase, Goldman Sachs, Bank of America and Wells Fargo wanted.40 President Obama indicated that he was opposed to the change, and the bill died in the senate.41 The episode nevertheless showed that the megabanks at the center of the 2008-09 crisis were already jockeying to shove their hands back in the deregulatory cookie jar by late 2013, and GOP lawmakers had their backs. ~$11.7 trillion went up in smoke and they learned little or nothing.
In 2014, the FDIC sued 16 banks in the U.S. and Western Europe in an episode that became known as the Libor scandal. TBTF stalwarts like JPMorgan Chase, Citigroup and BofA were among the defendants. Libor is an international interest rate that underpins ~$350 trillion worth of over-the-counter derivative trades, and the suit alleged these banks rigged the Libor rate from 2007 through at least 2011 in order to extract financial gains; Fannie Mae, Freddie Mac and U.S. municipalities were among the injured parties on the other side of those bets.42
Chuck Grassley, ever Johnny-on-the-spot, stood up to run cover for big finance. In a textbook case of muddying the waters, Grassley and a fellow GOP senator accused Treasury Secretary Tim Geithner of being aware of the Libor rate rigging. It was a ballsy move, even for card-carrying members of the #unholyunion: when an OPEC-type cartel was found operating in U.S. financial markets, their response was to accuse the closest top government official (who had no financial or professional interest in setting up or engaging in the fraud, and no evidence of Geithner’s knowledge of the rate rigging was ever produced) of being at the center of the scandal.43
Remember, the #unholyunion’s job ain’t done until any and all evidence of corporate malfeasance is twisted back onto the government by hook or by crook. Their playbook has a single page in it, and whether there’s logic or truth in their counteraccusations has nothing to do with whether they’ll play that card. They throw it down reflexively.
In September 2017, Citigroup paid $130 million to settle its part of the Libor scandal case.44 In 2020, JPMorgan Chase coughed up $920 million.45 BofA wound up with a $205 million fine.46
Standard & Poor’s coughed up ~$1.4 billion to settle a fraud lawsuit brought by the DoJ and 19 states that claimed Standard & Poor’s had inflated its ratings and underestimated the risks associated with the CDOs and RMBS that it was supposed to have been analyzing objectively from 2004 through 2007.47 The company agreed to a statement of facts about its conduct, then changed its name the next year to S&P Global Ratings (presumably to escape the cloud of stench hanging over its former brand).48 $1.4 billion recovered on $11.7 in trillion economywide losses. Hmm. I’m no economist but that strikes me as a negative ROI.
♦
Donald Trump, the unabashed fascist, compulsive liar and racist, started jerking the #unholyunion’s tax cut handle as soon as he got in the White House. The tax reform package his administration outlined in April 2017 had a regressive slant to it, naturally, which explains why Grover Norquist’s ATR immediately gave the proposal a standing salute and predicted that it would “turbocharge” the economy once enacted.49 The tax bill the President Trump signed in late ‘17 indeed delivered another lopsided win for America’s wealthiest families and biggest businesses.50 Rah, rah, team #unholyunion. Your laser focus on serving your #1 constituency is unyielding.
The Speaker of the House, Wisconsin’s Paul Ryan, couldn’t stop grinning as Trump’s tax cut neared the finish line. His Randian promised land was in sight at last. Ryan had been practically midwived by Jude Wanniski and George Gilder. As a Weekly Standard profile from 2012 noted, Ryan had grown infatuated with the l-f-lib ideology as a teenager, and by the time he got an internship in Senator Bob Kasten’s office, he was a true blue #trickledownfaithful zealot. Ryan kept bugging the senator’s staff director, Cesar Conda – who’d go on to become a USCC lobbyist and Senator Marco Rubio’s chief of staff – for any crumbs he could glean from the tables of Hayek, Friedman, Laffer and company:51
“Paul at age 19 was the exact same person he is today,” Conda recalls. “Earnest, personable, and hard-working, with an insatiable appetite for discussing policy ideas.” Ryan often popped his head into Conda’s office with questions about supply-side economics, interruptions that became so frequent Conda had to give Ryan books to keep him occupied. Among them: The Way the World Works, by one-time supply-side guru Jude Wanniski, and George Gilder’s seminal Wealth and Poverty. (Conda finally recovered his copy of Gilder in 2007, when he noticed it in Ryan’s office, heavily marked-up.)
Classic. The man who ushered Trump’s regressive tax plan through the House had, of course, guzzled supply-side economics Kool Aid for decades.
Wanniski, it’s worth noting, was drummed out of the conservative movement circa 2002 because he refused to accept that Saddam Husain had used poison gas on the Kurds in Iraq.52 Gilder had been excommunicated back in the 1980s because it turned out that he was a big believer in ESP.53 Let’s be clear: Conda is saying Ryan bought into what Gilder was selling after it was obvious the man was cuckoo for Cocoa Puffs. These are the geniuses whose works of archconservative government snuff fiction Ryan had dog-eared copies of on his bookshelf in his formative years.
Kevin Hassett, meanwhile, had failed upward once again and was now an economic advisor to President Trump.
Back in 2012, Hassett clarified that just because Wanniski and Gilder had turned out to be cranks, that didn’t mean their policy ideas were bonkers. As he put it to a New York magazine reporter at the time, “Even if one assumes that a theory has been put forward by an unbalanced person, that fact does not mean that the theory is incorrect.”54 Thank goodness the co-author of Dow 36,000 was on hand to clarify if someone with loose screws can also be a wildly inaccurate Friedman knockoff. Sí se puede, Kev!
The Trump-Ryan reform package was signed into law before Christmas in 2017. Major provisions of Trump’s Tax Cuts and Jobs Act (TCJA) included:55
- An increase in income tax regressivity. Through 2025, the top nominal rate for a married couple filing jointly dropped from 39% to 37% while a similar couple in the lowest tax bracket got no cut at all. Individuals’ alternative minimum tax (AMT) rate was also reduced.
- The estate tax’s exemption was doubled. The ~$5.5 million exemption for single filers went to >$11 million through 2025. Trump naturally lied when he said that “the crushing, the horrible, the unfair estate tax” was forcing small businesses and family farmers to liquidate assets in order to cover the bill (a topic we’ll revisit later in this chapter).
- Progressivity was entirely eliminated from the corporate income tax code. From a nominal rate of up to 39% for large corporations, the new flat rate became 21% across the board, a change that delivered an especially massive windfall for large banks. The AMT on corporate income was repealed to boot.
- The financial penalty for violating the individual mandate in the Affordable Care Act (ACA) was removed. Healthcare insurance premiums for those who stayed in ACA plans went up as a result, and millions of Americas that would have otherwise gotten health coverage went back to being uncovered.
Like some of Donald Trump’s other willing puppets, Treasury Secretary Steve Mnuchin was more than happy to voice the #trickledownfaithful lie that the TCJA’s tax cuts would pay for themselves. Mnuchin regurgitated the “Laffer Curve” myth in September 2017. That intellectual fraud was so self-evident that Milton Freidman denied the theory held water as soon as it surfaced in the 1980s. After Mnuchin made his remarks, Treasury officials initially refused to release the purported backing analysis, then later admitted no such analysis was done.56 That sounds about right.
The “Laffer Curve” myth is a variant on Grassley’s single-page playbook. Members of the #unholyunion are required to tell zombie lies whenever these lies make big businesses look good and/or pad their bottom lines, independent of what math, logic, history and science have to say on the matter. The CBO estimated the TCJA would add ~$1.9 trillion to the national deficit over its first ten years.57 The GOP’s response to this unjaundiced assessment of the TCJA’s impact was, predictably, a disinterested yawn.
The legislation’s corporate income tax cuts have paid off as advertised. Bloomberg reported in January 2020 that America’s top six MAGAbanks saved $32 billion in taxes in the preceding two years compared to what they would have paid absent the TCJA.58 Nice work, #unholyunion. The country took an $11.7 trillion hit primarily due to the irresponsible activities of big banks and the penalty you extract from these institutions is a massive tax cut that helped them grow bigger than ever.
The Trump administration and its enablers in Congressional turned their attention to Dodd–Frank next. The Economic Growth, Regulatory Relief and Consumer Protection Act was signed into law in May of 2018. The legislation, among other things, eliminated Dodd–Frank’s “Volcker Rule” for banks with <$10 billion in assets and exempted all but the largest dozen MAGAbanks from Dodd–Frank’s heightened regulatory scrutiny, and leading to speculation that M&A in big finance might pick up again.59
President Trump loved him some stock market in 2019. Bloomberg put together an excellent interactive timeline of Trump’s tweets about the economy and stock/bond market performance during his four-year stint in the White House and golf resorts nationwide. Trump tweeted about the DJIA, Nasdaq, S&P and a Curiously Capitalized “Stock Market” at least three dozen times in 2019.60
Here’s a pu pu platter of Trump’s tweets on the topic:
- January: “Dow just broke 25,000. Tremendous news!”
- February: “Since my election as President the Dow Jones is up 43% and the NASDAQ Composite almost 50%. Great news for your 401(k)s as they continue to grow. We are bringing back America faster than anyone thought possible!”
- April: “You mean the Stock Market hit an all-time record high today and they’re actually talking impeachment!? Will I ever be given credit for anything by the Fake News Media or Radical Liberal Dems? NO COLLUSION!”
- June: “Since Election Day 2016, Stocks up almost 50%, Stocks gained 9.2 Trillion Dollars in value, and more than 5,000,000 new jobs added to the Economy. @LouDobbs If our opponent had won, there would have been a market crash, plain and simple! @TuckerCarlson @seanhannity @IngrahamAngle”
- July: “Big Rally tonight in Greenville, North Carolina. Lots of great things to tell you about, including the fact that our Economy is the best it has ever been. Best Employment & Stock Market Numbers EVER. I’ll talk also about people who love, and hate, our Country (mostly love)! 7:PM”
- October: “Our record Economy would CRASH, just like in 1929, if any of those clowns became President!”
- October: “The S&P just hit an ALL TIME HIGH. This is a big win for jobs, 401-K’s, and, frankly, EVERYONE! Our Country is doing great. Even killed long sought ISIS murderer, Al-Baghdadi. We are stronger than ever before, with GREAT upward potential. Enjoy!”
- November: “Stock Markets (all three) hit another ALL TIME & HISTORIC HIGH yesterday! You are sooo lucky to have me as your President (just kidding!). Spend your money well!”
- November: “Economy is BOOMING. Seems set to have yet another record day!”
- November: “The best Economy ever! https://t.co/Ql8f16uGXD” (The link redirects to a CNBC Tweet that read, “This year is shaping up to be one of the best ever for investors, with nearly every single asset class on track to finish 2019 in the green”, and linked to an article on the topic.)
- December 2019: “New Stock Market high! I will never get bored of telling you that – and we will never get tired of winning!”
A consistent theme in the President’s tweets about U.S. stock/bond market performance in 2019 was that they conflated the economy and rising DJIA, Nasdaq and S&P valuations. Go back and read the tweets. Many of them destroy the line between the “Economy” and the “Stock Market”.
That these two things are somehow identical is one of the biggest lies woven throughout the bedsheets of the #trickledownfaithful’s bordello. As with many other things Trumpian, it’s unclear if the President was too dull to grasp that the stock market and, say, GDP can move in opposite directions (as they did in 2020 after the COVID-19 pandemic hit, and as they did in 1929 – the DJIA crashed late that year but real U.S. GDP ended 1929 higher than it was at the end of ‘28), whether Trump knew there was a difference between these two things and lied about because lying is like breathing to him when it makes him look good, or if Trump only knows people in the neo aristocratic class and so truly believed every American is a “Stock Market” investor.61
About half of U.S. households currently own some stock. Stock ownership penetration has certainly gone up a lot since the 1970s, the decade in which the pivot away from corporate-funded pension plans began in earnest and when IRA and 401(k) plans began their rapid ascent. The average household’s stake in the stock market is modest, though. Gene Sperling, an economist and a National Economic Advisor to Presidents Clinton and Obama, observed in a 2013 book that the typical middle-income American owned ~$15,000 in stocks at that point.62 In the mid-2000s, compensation experts at the Hay Group estimated the wealthiest 10% of U.S. households owned >75% of all U.S. stock, and that neo aristocratic households owned ~40% alone.63
America’s neo aristocratic class has been “winning” as a result of the Stock Market’s booms since the 1980s. The ~50% of households that don’t own stock have fallen further behind as a result. Spend what money well? The bull markets of recent decades have exacerbated socioeconomic inequity in America.
It’s actually worse than that. Not only have the benefits of stock ownership overwhelmingly accrued to members of the Mar-a-Lago Club class since 1980, the pivot away from the Arrow-Smith ideal simultaneously opened the door to more M&A between big businesses that also helped enrich the top 1%.
It’s been a triple-whammy, in fact. Neo aristocrats’ taxes and big business’ taxes have been slashed repeatedly as more M&A among big businesses has been allowed by federal law and the courts, and this antitrust sea change has been a massive contributor to huge gains in the DJIA, Nasdaq, S&P, and other stock/bond markets and indices. Neo aristocrats have hit the pro-inequality trifecta since 1980. No wonder Paul Ryan grinned from ear to ear in 2017: he and the likes of Stigler, Friedman, Wanniski, Gilder, Laffer, Rand and Trump have all gotten what they wanted in terms of concentrating America’s income and wealth. The TJCA was just another layer on an already #unholyunion-slanted cake.
M&A among big banks was a noteworthy element of a broader merger trend that has reshaped multiple U.S. sectors in recent decades. A Federal Reserve Bank of Philadelphia analysis from 2007, for example, found that the number of commercial banks had been stable in the 14,000 range from 1975 to 1985; from there through 2005 this number plunged to ~7,500 institutions.64 That’s >400 mergers a year on average.
We previously touched on the merger that created Citigroup in ’98, but Bank of America became a $1.4 trillion financial behemoth based on its acquisition of NationsBank in ’98 and FleetBoston in 2003. JPMorgan Chase entered $1 trillion club by acquiring Bank One in ‘04.65 These megadeals were the tip of a larger consolidation spear that’s concentrated U.S. financial markets since the mid-1980s.
A 2009 paper published by Essential Information, a corporate watchdog nonprofit, and the Consumer Education Foundation, a consumer protection watchdog nonprofit, found that America’s top five commercial banks handled 97% of the country’s derivative trading just prior to the Great Recession, and that “[a]ll of these banks are of a size — and most the product of mergers — that regulators and antitrust enforcers would not have tolerated a quarter century ago.”66 That’s an accurate statement. The M&A waves that have rolled through America’s financial markets since the ‘80s have had a larger amplitude than did comparable waves in the preceding generation in which Joe Bain ’s S-C-P approach to antitrust dominated in theory and practice.
In the mid-2000s, the top ten credit card issuers managed ~90% of U.S. consumer credit card accounts. Some 2,000 U.S. commercial banks issued credit cards in that point, but the largest of these institutions serviced >90% of America’s $623 billion in credit card debt. The comparable share of debt managed by the top ten card issuers back in 1990 was 55%, according to a 2006 study by the Federal Reserve Bank of Philadelphia.67 Financial M&A, including Bank of America’s $35 billion buyout of MBNA in 2005, has facilitated rising concentration in the consumer credit card space.68 It’s another piece of the TBTF financial firm conglomeration saga that we’ve been tracing in this chapter.
When a merger is announced between two public firms, both stocks generally go up. The day the Citicorp-Travelers deal was announced in April 1998, for example, the companies’ stock prices rose by $35 and $11 a share, respectively (to $178.50 and $73).69 The combined company’s stock price went on to exceed $500 in 2000, dropped to <$300 in the 2002 dot com crash timeframe, bounced back to >$500 by early 2007, and then slumped late that year as the scale of the home mortgage security crisis became clearer.70 (Sandy Weill grabbed a golden parachute from Citigroup in 2006 and still has a net worth of >$1 billion today.71)
The rationales behind M&A deals involving public companies partly rest on enhanced economies of scale arguments. If the companies are in the same market (a horizontal merger), of course, then the combined business gains market share and a formidable competitor goes up in smoke. Most investors love that. Why wouldn’t they, given the typical stock appreciation impact? Stock prices tend to go up as competition gets weaker. M&A in and of itself goes a long way in explaining why Stock Market valuations have surged since 1980. The “Economy” (GDP, but median household income or net wealth would be a fine substitute) hasn’t grown nearly as fast.
Coupled with stock buybacks, a practice that reduces the supply of available shares, and which also tends to drive up stock prices – just like eating a tablespoon of salt will hike your blood pressure – it isn’t hard to grasp why the DJIA and S&P have gone on big upward tears since the Reagan years.72
In chapter four, figure 25 used Economic Census (EC) data to show the share of revenue generated by the top 50 firms in America’s eight largest sectors from 1997 through 2017. The manufacturing sector was second on the list, at $5.55 trillion in revenue (or shipped goods value generated), and the sector’s 50 largest firms collected 28.5% of sector revenue. The finance and insurance sector placed fourth on this list in 2017, at $4.34 trillion in revenue generated; 45.7% of that sector’s revenue was absorbed by the top 50 firms. Finance and insurance was smaller than manufacturing in ‘17 but also more top heavy by revenue share.
Let’s now double-click on the finance and insurance sector. Can we use EC data to tell if our assertion that M&A played a key role in the concentration of finance and insurance market revenue (and the attendant public company valuation hike) holds water?
The finance and insurance sector generated $2.2 trillion in revenue in ’97, per the EC, and its 50 largest firms collected 36.8% of sector revenue that year. Manufacturing’s comparable totals in ’97 were $3.83 trillion and 23%. Compared to manufacturing, finance and insurance grew faster in absolute terms between 1997 and 2017 and its revenue became more concentrated among its top 50 firms. Without adjusting for inflation, manufacturing’s revenue rose $1.72 trillion over this two-decade span compared to finance and insurance’s $2.14 trillion increase. Manufacturing saw a 5.5% rise in the share of revenue going to its 50 largest firms while finance and insurance’s bump was 7.1%.
The result implies that M&A among big businesses could have had a more profound effect in finance and insurance than in manufacturing, but Joe Bain showed us how to do better than that, no? Let’s drill down into the finance and insurance sector’s largest industries to take a closer look at their internal revenue and concentration dynamics, and from there we’ll circle back to the potential M&A connection.
Finance and insurance’s top ten industries in 2017 (based on the 6-digit NAICS codes in the EC data set) were as follows, in descending order of revenue: direct health and medical insurance carriers, direct property and casualty insurance carriers, direct life insurance carriers, commercial banking, portfolio management, insurance agencies and brokerages, credit card issuing, securities brokerages, sales financing, and investment banking and securities dealing.73 Those ten industries ranged from a high of ~$856 billion in revenue generated (in direct health and medical insurance) down to ~$105 billion (in investment banking and securities dealing). Together, these industries generated ~$3.24 trillion, or ~75% of the sector total in 2017.
Let’s now divide this sector into its constituent subsectors and review the results.74 Six of the ten largest industries noted above belong to the financial subsector and four belong to the insurance subsector. Finance’s six biggest industries hauled in $1.86 trillion in 2017, and the top four firms in these industries collected an average of 29.5% of that revenue.75 The like numbers for insurance’s big four industries totaled ~$2.05 trillion and 29.6%. Insurance was somewhat bigger in 2017, then, but the revenue concentration levels across both subsectors were nearly identical.
Now let’s now rewind the tape to 1997 and rerun the figures. The same ten largest industries in finance and insurance generated $1.78 trillion that year (none of these figures are inflation-adjusted), which translated into ~81% of the sector’s $2.2 trillion in revenue. The six financial industries brought in ~$759 billion all told in ‘97, and a weighted top four firm revenue share came to 25.5%. The like numbers among the top four insurance industries were $1.05 trillion and 22.2%.
The upshot over the 1997-2017 period, then, is that insurance’s largest industries grew faster in aggregate than the financial subsector’s largest industries by revenue – a topic we’ll revisit later in this chapter – and both these industry groups saw a rising share of revenue going to their top four firms (a 7.4% share increase in the case of the insurance industry group and a 4% rise in the financial industry group). In effect, the net rise in 50-firm revenue concentration level from 1997 to 2017, as shown in chapter 4’s figure 25, was the result of a rise in revenue concentration among the largest firms in both the finance and insurance subsectors. We’ve gone a couple levels down here and can add that the same pro-concentration trend is evident if the top four companies in these subsectors are examined.
The M&A trend inside finance, which was quantified by the Federal Reserve Bank of Philadelphia between 1990 and the mid-2000s in the commercial banking and consumer credit card industries, sure seems to be showing up in the EC’s industry-level data sets, and this consolidation trend likely continued through 2017.
Let’s use EC data to peel this onion back one more layer. A classic definition of “Wall Street” certainly includes the commercial banking and the investment banking and securities dealing industries.76 The top companies in these markets are a who-who list of TARP-receiving banks and home mortgage security derivative peddlers.77 A third financial industry, credit card issuing, is more on the bubble. Since three of the top four card issuers (and four of the top eight) in 2016 were on the TARP recipient list noted earlier, it appears fair to include credit card issuers in the definition of “Wall Street” industries.78 Most of these financial behemoths have enterprise and consumer business lines.
Let’s rerun the EC numbers for just these three industries. From 1997 to 2017, revenue in these industries increased by $134 billion, to about $699 billion in 2017.79 That works out to 59% of the revenue generated in the top six financial industries (as listed earlier). Wall Street’s top four firms, on average, collected more than 33% of all revenue generated in these three industries. The comparable 4-firm share of revenue in 1997 was <23%. That means there was almost an 11% swing in revenue concentration towards Wall Street’s top four firms in this two-decade span.80 That’s a faster rise than across the top six financial industries put together (and a faster rise than across the four largest insurance industries noted earlier).
Simply put, America’s biggest TBTF institutions gained market share coming out of the Great Recession. There’s no way that associated M&A deals didn’t contribute to the rising revenue concentration trend that showed up in the EC data. I’d bet dollars to donut holes that Wall Street’s comparable top four firm share of revenue generated was well below 20% if the clock were rewound all the way to the mid-1980s.
Your eyes haven’t deceived you, America: Wall Street’s biggest players have been supersized in the past generation, and M&A inside the top tier of firms contributed to this outcome and helped push up these firms’ stock prices, culminating in Trump’s glowing 2019 tweets about the “Economy”. All of the pieces of evidence fit together and tell the same story: primarily driven by stepped-up M&A, Wall Street’s top guns have gotten a lot bigger in the past generation, and that’s helped make them more valuable as well as “systemically important” from the Fed’s and Treasury’s perspective – their sheer scale is what has punched their tickets onto the TBTF list. Big business is big government and big government is big business in the financial sector especially. It’s what led to TARP’s passage. Mi casa es su casa, comrade.
♦
If Donald Trump wanted to accurately characterize the growth of the “Stock Market” in 2019 then he should have used the Wilshire 5000 index. The Wilshire 5000 is a market-cap-weighted index that includes practically every actively traded U.S. stock. The index included ~3,500 stocks at the end of 2019, making it more representative of the “Stock Market” than the NYSE Euronext, Dow, Nasdaq or S&P 500.81
The Wilshire 5000 Total Market Index debuted in late 1980. Its initial value was about 1,400 points, and its market cap came to ~$1.4 trillion.82 In the year 2000, the index hit a new high, in the neighborhood of 14,750, which was a tenfold increase over its initial value. The index dropped in the so-called dot com crash period (to <10,000), climbed back over 15,000 by 2Q 2007, plunged again during the financial crisis (bottoming out <7,000 in March 2009), and then rebounded from there to >20,000 through late 2014. From there it kept climbing to 30,000 in 2019, took another hit during the COVID-19 pandemic (it declined quickly to <25,000), but has since surged back to >47,000 as of 4Q 2021.83
To say the Stock Market has done well since 1980 is an understatement. Let’s reiterate what the Stock Market’s valuation increase hasn’t been, though: a proxy for broad U.S. economic growth. The Wilshire 5000 index has appreciated far faster than the U.S. GDP since 1980, even after adjusting for inflation. The index also has an incredibly weak relationship to the wealth and income trends of the roughly half of U.S. households that don’t own stocks. Precious few of those households have gotten “tired of winning”.
The Wilshire 5000 index’s growth had mirrored something else far more closely: the merger waves that have rocked the U.S. economy in recent decades. There’s broad agreement in academic circles that America has experienced seven major merger waves since the late 1800s. Thomson Financial and the Institute for Mergers, Acquisitions and Alliances (IMAA) have done a great job tracking this phenomenon over time, and especially since 1980. Here’s is a brief summary of America’s seven major M&A waves:84
- The Great Merger Movement peaked out circa 1899-1900. We covered this wave in chapter three and won’t rehash the particulars here. The Great Merger Movement was mainly about horizontal consolidation in manufacturing (companies in that sector were exempted from the Sherman Act based on an 1895 Supreme Court decision), and the wave ended in the early 1900s, after the #progpop era’s norms and practices started kicking in with greater force.85
- A wave in the Roaring Twenties preceded the “Stock Market” crash and Great Depression. The crest of this wave came in 1929-30. Academics point to mergers in the banking subsector as a key driver of the wave, although conglomerate (vertical) mergers in many other markets, including manufacturing, contributed.86
- Another wave peaked in 1969-70. 1969 was the year, remember, that the “Stigler Report” leaked. The Nixon administration took its foot off the S-C-P era’s antitrust enforcement gas pedal in that timeframe, as chapter three also noted. This wave mainly involved conglomerate mergers – the very type of M&A deals that Stigler et al wanted the government to stop blocking. This wave crashed on the shoals of the 1973 OPEC oil embargo that threw the U.S. into stagflation angst.87
- The next wave crested in 1988-90. It’s been characterized as the first “deregulation” wave. The number of large M&A deals climbed steadily through the Reagan administration’s second term. Some of the largest associated deals involved companies in technology-intensive industries, and “hostile takeover” strategies came to the fore.88
- The next wave peaked in 1998-2000 and involved financial market consolidation (the formation of Citigroup is a leading exemplar), although a range of other “megadeals” were consummated in this period (Exxon and Mobil came together here, as chapter four outlined). U.S. companies acquired more foreign companies during this wave too, and high-tech and telecom deals increased; this wave is considered linked to the fist deregulatory wave. The dot com crash ended the wave.89
- Next up was the pre-financial crisis and Great Recession wave. It peaked in 2006-07. After the dot com crash, Alan Greenspan’s Federal Reserve kept interest rates (the funds rate) unusually low for a non-recession period. That translated into cheap cash for big financial firms and private equity funds, and they went to town and bought giant chunks of it. Excess liquidity helped fuel a speculation spree.90 Let’s pause and pour one out for professor Hyman Minsky, and then wave to Wall Street’s shit-filled RMBS’s as they pass by us on the conveyor belt and get AAA stamped by the rating agencies.
- The last wave peaked in 2017-18 and came to a crashing end with the onset of the COVID-19 pandemic. Vertical buyouts were back on the menu this round, and high-tech acquisitions plus abundant liquidity (the Fed cut the interest rate to almost zero between 2010 and 2014) helped fuel the wave.91
What does this summary of America’s seven major M&A waves in the past ~125 years teach us? Well, for starters, it suggests the S-C-P era and the unholy union era were, and are real phenomena. The #progpop era’s enforcement teeth kicked in after the Great Merger Movement wave. Prior to the Sherman Act, there were no federal antitrust enforcement laws or related enforcement processes in place, and no broad social consensus that monopolies/oligopolies and U.S. capitalism were a bad and dangerous mix.
This understanding changed in the early 1900s. The Clayton Acts were passed circa World War I, and for the first time, meaningful federal limits on horizontal and vertical mergers became the law of the land and were enforced. A massive Stock Market rally unfolded in the 1920s, to be sure, and the antitrust laws and practices at that time clearly weren’t enough to stave off an associated major M&A wave (as wealthy speculators in finance and manufacturing snapped up competitors). The late 1920s wave is a clear blemish on the #progpop era’s antitrust record. A major wave unfolded on its watch, no doubt about it.
The S-C-P era began during FDR’s New Deal administration, as chapter three detailed, and the federal government ramped up its antitrust apparatus greatly in this period. In the post-World War II generation, there wasn’t a major M&A wave. The sole M&A wave that occurred during the S-C-P era’s heyday was the 1969-70 wave. After that conglomerate wave, another lull ensued for over a decade, until the Reagan administration’s second term (the peaks between these waves, in fact, were nearly two decades apart).
The deregulatory effects of the #l-f-lib revolution had begun to have real-world impacts on big business M&A trends by that point. Stigler’s ideology gained the upper hand inside key federal agencies. The courts also sensed this turning of the tide and started going with the #unholyunion flow, generally speaking, in the 1980s. Commercial banks began to consolidate at a faster clip late that decade, as we’ve documented, and America began to look the other way on its growing list of TBTF financial firms.
After the late 1980s wave, another M&A wave crested in the late ‘90s. Another M&A wave then crested circa 2007. Another crested in 2017-18. Do you see the difference? There were two major M&A waves across the #progpop and S-C-P eras, which lasted from roughly 1905 through 1985. That’s one major M&A wave per 35-year stretch.
Since the #unholyunion gained the upper hand, there’s been a major M&A wave every decade and the 1990s and 2000s waves had a pronounced financial flavor to them. It’s part of their intelligent design scheme. They’ll tell you there’s no downside to this change but they’re wrong, according the Arrow-Smith ideal. There is an equal and opposite socioeconomic cost, and then some, jetting out the other side. What America has been doing is burning the foundation of its competitive, efficient capitalist market structure in the name of Randian “freedom” and near-term public company “sugar rushed” profit highs.
Every major M&A wave in U.S. history has ended in recession. All seven have been followed by a downturn immediately or by <1 year.92 Future M&A waves are quite likely to carry the seeds of recession in them. Two of the seven major M&A waves ended in the worst economic downturns in U.S. history. There’s a reason the Great Depression and Great Recession are linked in people’s minds.
The big difference between these disasters that we didn’t fix our market concentration problem coming out of the Great Recession, especially our financial subsector concentration problem. We’ve left room for the same financial bomb to be rewired and are whistling past the graveyard on the dangers and low morals that attend high inequality. There’s no reason to think another Great Recession isn’t in our future. It’s a matter of when, not if.
If you still think America’s “Stock Market” valuation rise since 1980 hasn’t mainly been a big business M&A story, then hopefully you’ll find figures 28 and 29 convincing. Figure 28 shows the number of M&A deals in North America, and more importantly for our purposes, the value of M&A deals as a share of GDP between 1985 and 2018; this approach normalizes the data and mitigates inflationary effects. There’s incomplete data for 2019 in the rightmost column in figure 28, so discount that last data point. Canada was a little under 8% of North America’s GDP in 2018, so figure 28’s results overwhelmingly reflect what’s gone on in the U.S.
These data were cited in the senior thesis by an economics student, Katherine Ching, at Scripps College in California, but her underlying data was sourced from Thomson Financial and the IMAA.93 Check out figure 28’s orange line. Its peaks line up quite well with the four major M&A waves in the 1985-2018 timeframe, which are highlighted by red circles. Clear troughs followed each of these waves, as the U.S. economy tanked and M&A deal values slumped.
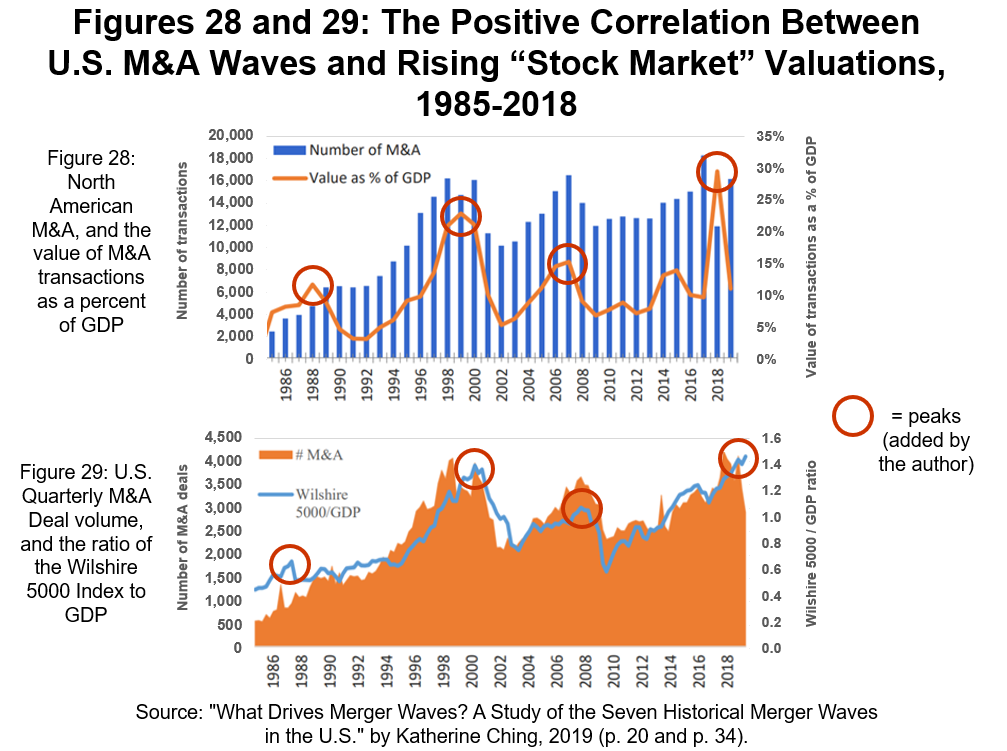
Now check out the blue line in figure 29. This figure is U.S.-specific, and data were pulled quarterly rather than annually, but the ratio of the Wilshire 5000 index’s market cap to U.S. GDP, as can be seen, produced a line that’s very similar to the orange line in figure 28. Figure 29’s data came from Thomson Financial, the IMAA, and the Federal Reserve Bank of St. Louis. I’m sure an econ student could calculate the exact correlation, but it doesn’t take a rocket scientist to grasp that the correlation between these lines is strongly positive.
Figures 28 and 29 represent solid evidence that the rise in the Stock Market since the mid-1980s has been mainly a story of big businesses M&A deals. This rise has come at the expense of robust U.S. competitive dynamics and the tills of private SMBs. Rising socioeconomic inequality has been a side-effect of America’s back-to-back-to-back-to-back M&A waves since 1980.
There’s a social cost to these feast or famine waves. If the economies of scale advantages from M&A deals don’t get passed on to the typical human being or family a given socioeconomic system, all you’ve accomplished through weak M&A standards is to exacerbate inequality and undermine the core rationale for having a capitalist Economy. Throw Grassley’s zombie lie card down all you want, but that Tower of Babel will eventually crash down. It’s physics. When a highly unequal structure fails, it fails spectacularly. That’s the Great Depression, that’s the Great Recession. They’re flashing warning signs not to go further this way.
The blue line in figure 29, by the way, is close to what some investors call the Buffett Indicator. Warren Buffet reportedly uses the S&P 500’s market cap rather than the Wilshire 5000’s market cap as the numerator in his equations, but the end result is similar. Buffet believes that as this ratio rises, so does the chance that the Stock Market is overvalued and ripe for correction (which recessions inevitably deliver). When that ratio starts to climb quickly, and when it rises above a certain point, Buffet tends to take a pile of his chips off the table, and that’s worked out well for Berkshire Hathaway.94
Perhaps the biggest stain on the Obama administration’s tenure came in the area competition policy. His administration allowed M&A guidelines to be further watered down. In 2010, the FCC and DoJ changed their guidelines in a manner that moved the goalposts back rather dramatically. Markets and industries with HHIs between 1,500 and 2,500 have since been considered moderately-concentrated. It now takes HHIs >2,500 to qualify as highly-concentrated. The high-concentration goalpost was moved back ~30% in 2010 compared to where it stood relative to the end of Reagan’s first term. That change was a huge mistake.
Companies naturally tried to jump through this newly formed breach. In March 2011, for example, AT&T announced its intention to buy T-Mobile USA. AT&T went on a PR blitz in an attempt to convince people they’d be better off as a result of the economies of scale upsides that would stem from the deal’s approval: rural areas would get faster access to 4G/LTE cell services, there’d fewer dropped calls, faster data rates, better in-building coverage, etc. The kicker is that AT&T claimed tens of thousands of new jobs would be created if the deal was approved.95 Line up for the milk and honey, fams.
AT&T’s stock price stood at ~$27 per share before the deal was announced, and it rose to $32 afterwards. The DoJ pulled the tap from AT&T’s keg in August when it announced a suit to block the merger.96 AT&T’s stock price fell back to ~$28 by the end of the month. Note the strong correlation, again, which suggests that what most investors want is more horizontal mergers between big businesses. Companies will fill the void leftover from regulatory pullbacks, just as S-C-P era antitrust regimen supporters warned they would.
The HHI value in America’s mobile/cellular industry was already ~2,850 in 2010.97 The wireless industry broke through the FCC’s looser definition of a concentrated market in 2005. AT&T’s proposed buyout of T-Mobile USA was a simple test of whether or not the government would adhere to its own watered-down policy of minimal competition in the cellular service space.
In 2009, the FCC divided America into >700 local cell markets. 30% of those markets had three or fewer wireless service providers, per the FCC’s model. Only 4% of local markets back then had 6+ providers. The highest HHI, found in parts of Nebraska and Wyoming, was in the 6,600 range. That’s close enough to give perfect monopoly (an HHI of 10,000) a sloppy kiss. The FCC’s suit stated that if one of the four largest market agents in the cellular market was absorbed by a rival, competition would take a big hit and one of the likely outcomes would be that customers’ bills would go up.98
Let’s slow our roll to appreciate the FCC’s position here. A key rationale for M&A deals that involve companies with the scale of AT&T and T-Mobile is that economies of scale advantages will come out the other side and these efficiencies may be passed on to customers in the form of lower bills. Yet the FCC claimed that not only wouldn’t those efficiencies be passed on to customers, if the deal went through, but that the opposite would happen – customers’ bills would likely rise.
The AT&T-T-Mobile deal didn’t happen. T-Mobile wound up taking billions of dollars that it got from AT&T based on its failed attempt to buy T-Mobile and used it to leapfrog Sprint…and then T-Mobile bought Sprint in 2020. The merger among the top four wireless market players ultimately happened, thanks to the loosened FCC/DoJ/FTC guidelines, but between the #3 and #4 market players instead.
An HHI over 2,500 equates to a market in which four competitors that each generate a quarter of market revenue. That’s “enough” competition per the U.S. government’s current guidelines. Go back and skim chapter three and tell me how far away from the Arrow-Smith ideal America has drifted since the 1950s and 1960s. Go reread that chapter’s Neal Report section to full appreciate how far the #unholyunion’s ball has moved down America’s capitalist field since then. I’ll wait.
If you still don’t think data from the FCC, DoJ, Thompson Financial and the IMAA are accurate in terms of their reflecting a deterioration of competitive dynamics in U.S. markets since 1980, then hopefully the work of three more professors of finance can slam the door shut on your lingering doubts. Rice University’s Gustavo Grullon, York University’s Yelena Larkin, and the University of Geneva’s Roni Michaely looked at the same EC data that I analyzed earlier in the financial subsector, but the professors considered EC results over the 1997-2012 timeframe and conducted a much wider, more sophisticated analysis of M&A’s impacts on industry-level competitive dynamics than I could ever hope to do.
We met this trio of professors near the end of chapter four. Their 2018 paper, “Are U.S. Industries Becoming More Concentrated?”, answered that question affirmatively and backed up the methodology that Joe Bain and like-minded academics used at the intersection of microeconomics and competition/antitrust theory in the S-C-P era. Grullon, Larkin and Michaely examined EC data as well as M&A transaction records in the 1997-2012 timeframe to check whether this combination was:99
…an alternative way to test whether market power is the mechanism behind higher profitability in industries with increased concentration. If industry concentration has an impact on firms’ prospects, then the market should react more positively to announcements of transactions that further erode product market competition. We find that mergers of firms in the same industry have become more profitable to shareholders in general, as the market reaction to merger announcements is higher in industries with higher concentration levels…
Further consistent with this [market power] hypothesis, we show that related mergers are more profitable when markets are more likely to become highly concentrated…
Joe Bain pantsed George Stigler in the 1980s by leveraging industry-level data from the EC in manufacturing to show that a positive correlation existed between industry concentration and profitability. Bain’s analysis demonstrated that Stigler’s alleged free lunch regarding M&A deals among big businesses was no free lunch at all once a rigorously scientific methodology was applied to that granular data set. Higher concentration levels generally meant higher profit margins, Joe Bain found. Companies in concentrated industries tended to pocket the economies of scale advantages they reaped from buying their peers. The did not tend to pass those savings on to customers in the form of lower prices.
The work of Grullon, Larkin and Michaely showed the exact same dynamic played out through at least 2012 across a wide range of U.S. industry groups tested. The trio of economists connected the EC’s dots on rising concentration to rising shareholder returns:100
We also show that the higher profit margins associated with an increase in concentration are reflected in higher returns to shareholders. Overall, our results suggest that the nature of U.S. product markets has undergone a shift that has potentially weakened competition across the majority of industries…
We next examine whether increasing industry concentration has been accompanied by an increase in corporate profits. If markets are contestable, i.e., with few barriers to entry, then even firms operating in highly concentrated industries should behave as if they have many competitors (Baumol, 1982). Alternatively, significant barriers to entry, including economies of scale, technological barriers, and large capital requirements, may cause firms operating in increasingly concentrated industries to exercise market power and generate larger abnormal profits (e.g., Bain, 1951, 1956)…
We find that over the past two decades, profitability has risen for firms in those industries experiencing increases in concentration levels. Using various industry definitions, we document a positive correlation between changes in concentration levels and return-on-assets (ROA). When we decompose this profitability measure into operating efficiency, proxied by asset utilization (i.e., sales to assets ratio) and operating profit margins (i.e., Lerner Index), we find that the higher return on assets are mainly driven by firms’ ability to extract higher profit margins. A change in concentration levels in the magnitude of its interquartile range, i.e., 75th minus 25th percentile, increases profit margins by 142% relative to its median, whereas the same change increases Asset Utilization by only 6%. These findings suggest that firms in concentrated industries are becoming more profitable mainly through higher profit margins rather than through higher efficiency.
Bang. Take a bow, Joe Bain. The professors’ paper additionally found there was “…evidence that returns to shareholders increase as industries become more concentrated…[and that]…the increase in profitability stemming from increased market power has been transferred to investors by generating higher abnormal returns.”101
The professor’s research suggested a “You scrub my back, I’ll scrub yours” relationship exists between investors and the corporate boards and execs of public companies. Most investors want more vertical and horizontal mergers to take place and, just like corporate lobbyists, they’re happy to push lawmakers to keep those M&A goalposts moving back and back and back and back. The effects of those changes on capitalism as a medium for conducting efficient transactions is utterly lost in their calculations. It’s N/A, a casualty of the l-f-lib’s war on the Arrow-Smith ideal. They don’t think that public good exists.
There’s no free lunch here. That’s what Joe Bain and the S-C-P model writ large tells us, if we apply that methodology with rigor to industry-level data from the EC, Thompson Financial, the IMAA, etc. There’s been a vastly underappreciated social cost jetting out the other side of the #trickledownfaithful’s inequality engine in recent decades. U.S. industries have grown more concentrated over time and that decrease in competition has helped other countries, especially those that have maintained a more competitive version of capitalism (wikicapitalism), pass us by in many respects. We’ve driven up inequality and weakened America’s competitive dynamic.
The work of Grullon, Larkin and Michaely strongly suggest that the FCC’s argument, in its suit to block AT&T’s buyout of T-Mobile in 2011, holds water: once those companies got together, they would have hiked the bills on customers who had virtually nowhere else to turn. That’s the rule, not the exception.
Another important piece of that socioeconomic cost, that negative externality which has stemmed from America’s half-century-long drift away from the Arrow-Smith ideal may also be showing up in our rising national debt. Part of Stigler’s and Friedman’s free lunch lie could be staring us all right in the face. The federal government now has a massive reservoir of red ink, and every American owns a giant mug of it. We’ll examine the supersizing of America’s national debt in the next section, and clarify its connection to the #unholyunion.
References