You didn’t know it, you didn’t think it could be done, in the final end he won the wars / After losin’ every battle
– Bob Dylan
The Reagan administration abandoned monetarism in the mid-1980s, as chapter four outlined. What wasn’t expanded upon there was just how complete the theoretical collapse of monetarism has since been. The core assertion of monetarism is that central banks can control a nation’s money supply through the buying and selling of securities like Treasury Bills, and when that process is handled at a steady and judicious pace, inflation will be kept in check. “The theory holds that by maintaining steady, moderate growth of the money supply, governments can assure a steady level of inflation-free economic growth,” a New York Times piece explained in July, 1986. “But beyond that, monetarists say, efforts by government, through tax and spending policies, to manipulate the economy typically do more harm than good. That is part of the theory’s conservative appeal.”1
How well monetarism has held up under real-world testing was characterized by a pair of IMF economists in 2014. “The money supply is useful as a policy target only if the relationship between money and nominal GDP, and therefore inflation, is stable and predictable,” wrote Sarwat Jahan and Chris Papageorgiou of the IMF. “That is, if the supply of money rises, so does nominal GDP, and vice versa. To achieve that direct effect, though, the velocity of money must be predictable…But in the 1980s and 1990s [and ever since] velocity became highly unstable with unpredictable periods of increases and declines.”2
Monetarists’ velocity measure parted ways with measurements of the money supply and GDP around 1980. Paul Krugman, a Nobel Prize-winning American economist and professor, summed up the political context that surrounded monetarism’s initial rise and application. Conservatives, he wrote in 2011, “have always tended to view the assertion that government has any useful role in the economy as the thin edge of a socialist wedge. I’ve always considered monetarism to be, in effect, an attempt to assuage conservative political prejudices without denying macroeconomic realities.”3 Friedman’s and Schwartz’s monetarist theory, as described in their 1963 book and tweaked through the ‘70s, Krugman continued, said, “yes, we need policy to stabilize the economy – but we can make that policy technical and largely mechanical, we can cordon it off from everything else. Just tell the central bank to stabilize M2, and aside from that, let freedom ring!”
Monetarism was always a child of the l-f-lib ideology. The main point of monetarism was that it rationalized implementing extremely limited governance norms. Once monetarist theory diverged from reality in the early 1980s, Friedman and company didn’t admit defeat and go back to the drawing board but instead retrenched only slightly, acknowledged Friedman’s biographer, and kept asserting that by using some “variant of M2 (currency plus demand and time deposits) – a reasonable enough approximation of the money supply can be attained for policy purposes.”4
Reagan abandoned monetarism because the country fell into a painful double dip recession in the early 1980s and his administration concluded that the Fed and many other federal agencies needed to do more to stimulate the economy than was called for in the monetarist prescription. The Fed’s chairman, Paul Volcker, whose tenure bridged the tail end of the Carter administration and most of Reagan’s White House tenure, was a monetarist, as chapter four noted, and Volcker clamped down on the money supply in late ‘79 because America was experiencing an inflationary surge as a result of the second oil crisis. Volcker applied the monetarist brakes to tame inflation, but not only didn’t inflation fall as the theory said it should, the economy tanked. Once Volcker took his foot off the monetarist brakes, the economy briefly recovered.
Inflation remained elevated until late 1982, which is when the price of crude oil fell back towards its historical baseline (see chapter 4’s figure 23). The U.S. economy also fell into one of the worst four recessions we’ve had since 1970 in the 1981-82 timeframe.
That was the context that surrounded the Reagan administration’s abandonment of monetarism. It wasn’t a particularly loud, public break until the New York Times exposed the policy shift in 1986. The ideas behind monetarism survived their head-on collision with real-world testing, which demonstrated they resided somewhere between badly misguided and outright dangerous. “Hints of the problem arose in the late 1970’s,” explained the New York Times article. “It worsened with the deregulation of the nation’s banking system at the start of the 1980’s, with the introduction of a wide variety of special accounts. With the decline in interest rates and the decline of inflation, spotting the money that matters has become utterly impossible.”5
Ironically, the Chicago Schoolers’ early wins in financial system deregulation apparently contributed to the implosion of monetarist theory. “Many economists who had been convinced by monetarism in the 1970s abandoned the approach” by the mid-1980s, explained the IMF’s Jahan and Papageorgiou. “Most economists think the change in velocity’s predictability was primarily the result of changes in banking rules and other financial innovations. In the 1980s banks were allowed to offer interest-earning checking accounts, eroding some of the distinction between checking and savings accounts. Moreover, many people found that money markets, mutual funds, and other assets were better alternatives to traditional bank deposits.”6 Defining the “money” in monetarism, and tracking its velocity by extension, had become a fool’s errand.
It doubtful that Ken Arrow ever believed Friedman’s and Schwartz’s pet theory held much water. Within months of the Reagan administration’s public break with monetarism, Arrow published a piece in The Journal of Business that more or less called monetarism irrational. In “Rationality of Self and Others in an Economic System”, Arrow touched on different examples of irrationality in economics, but one of his prime examples was monetarism. Arrow acknowledged the “price- and wage- rigidity elements” of Keynesianism had rationality gaps as well, but then dropped this deuce in Freidman’s and Schwartz’s laps:7
But if the Keynesian model is a natural target of criticism by the upholders of universal rationality, it must be added that monetarism is no better. I know of no serious derivation of the demand for money from a rational optimization. The loose arguments that substitute for a true derivation, Friedman’s economizing on shoe leather…introduce assumptions incompatible with the costless markets otherwise assumed. The use of rationality in these arguments is ritualistic, not essential. Further, the arguments used would not suggest a very stable relation but rather one that would change quickly with any of the considerable changes in the structure and technology of finance. Yet the stability of the demand function for money must be essential to any form of monetarism…
Deregulation contributed to changes in the structure and tech relating to finance circa 1980, and that’s when monetarist theory parted company from science-based measurements. Arrow was basically saying Friedman, the emperor of monetarism, never wore any clothes. Ken Arrow was a gentleman.8 This paragraph is as close to a body slam of a colleague as one can find in his writings. A Joe Bain bulldog he was not.
Krugman maintained that the “neoclassical synthesis”, by which he meant the union of Friedman’s and Schwartz’s macroeconomic monetarist model and Stigler et al’s microeconomic theories that claimed more M&A between big businesses was justified and that the proper response to regulatory capture was to demolish governments’ antitrust apparatus – was always an “awkward construct. Economists were urged to build everything from ‘micro foundations’”, Krugman wrote in 2016. “But to get a macro picture that looked anything like the real world, and which justified monetary activism, you needed to assume that for some reason wages and prices were slow to adjust.”9
For monetarist theory to hold water, real-world wages and prices needed to be “sticky”. Not only were those assumptions irrational, as Arrow pointed out, real-world testing showed this “stickiness” wasn’t always there.
A UC Berkeley economics professor, J. Bradford DeLong, also examined how monetarist theory evolved over time. In a late 1999 article, DeLong wrote that a transformation occurred in monetarist theory. Prior to America’s initial stagflation bout in the mid-1970s, “Classic Monetarism” had been couched in quite guarded and qualified terms. This changed after stagflation, the period in which “Political Monetarism” became strident and absolute in its predictions and language, according to DeLong:10
Political Monetarism argued not that velocity could be made stable if monetary shocks were avoided, but that velocity was stable. Thus the money stock became a sufficient statistic for forecasting nominal demand, and central bankers could close their eyes to all economic statistics save monetary aggregates alone. Political Monetarism argued not that institutional reforms were needed to give the central bank the power to tightly control the money supply, but that the central bank did control shifts in the money supply. The central bank was the source in its actions or in its failure to neutralize private actions of all monetary forces. Everything that went wrong in the macroeconomy had a single, simple cause: the central bank had failed to make the money supply grow at the appropriate rate.
It’s DeLong’s “Political Monetarism” that imploded when Volcker’s Fed put its tenets to the test in 1979-82. Reality didn’t map to the theory’s implied outcomes. In a sense, Friedman and company were whacked on the nose by reality and their response was to retreat into the softer language of “Classic Monetarism”. Their language got vaguer, but they never came close to admitting how total their theoretical defeat really was.
“Political Monetarism” held that policies that didn’t affect “the quantity of money and its rate of growth” wouldn’t “have a significant impact on the economy”, DeLong continued, and that’s precisely what the Reagan administration had rejected by the mid-1980s because the economy had twice fallen into recession and the Fed’s hands were tied by Friedman’s and Schwartz’s rigid, impotent theory.11 Reagan ignored monetarism’s restrictions and his administration took a big leap back in the direction of Keynesianism. The economy then recovered, as that theory predicted. “Political Monetarism crashed and burned in the 1980s,” wrote DeLong. Elements of the theory “turned out to be empirically false” and were “not the world that we turned out to live in.”12 The Reagan administration came to a fork in the road and followed what worked in the real world.
True blue l-f-lib ideologues like Friedman can’t do that. They may retrench and adopt vaguer and more subjective terms, but then they keep reciting their zombie lie mantra to nonbelievers. “Monetarism is dead. Long live monetarism.”13
This retrenchment is arguably the germ of what has grown into Trumpism: a full-throated rejection of all math, logic, history and science when they fly in the face of l-f-lib articles of faith. This retrenchment is the genesis of Grassley’s zombie lie playbook: when you’re caught stretching the truth beyond all credibility, the right response for l-f-lib ideologues is to go on offense against their accusers and repeat their lies louder.
Even Hayek left the smoldering wreckage of monetarism in the dust by 1990. Friedman had used Hayek’s ideas to create monetarism in the first place, so this amounted to the l-f-lib Sith Master rejecting the life’s work of his apprentice. Like the arch-Keynesians James Tobin and Paul Samuelson, observed Friedman’s biographer, Hayek concluded that Freidman was no longer able “to say what money is…‘It seems to me,’ wrote Hayek, that Friedman draws a “sharp distinction between what is to be regarded as money and what is not, [a distinction] which in fact does not exist.’”14 Ouch. These are not the droids you’re looking for.
No company or family would willingly subject themselves to monetarism’s narrow set of allowed response options in a crisis. Keynesianism supports a wide range of potential responses to economic problems that naturally come in a variety of forms. Monetarism is like getting into an airplane cockpit and telling the pilots that they can only touch two or three levers, knobs and buttons and must safely fly and land the plane. Nobody in their right mind would straightjacket themselves in that way.
The #MAGAheads would have you believe that this is how the world’s largest economy is properly managed. They pine for max freedom and then only shove the government into an absurd straight-jacket. That’s how you know it’s an ideology and not a principle or an objective, science-backed theory: there’s a massive gulf between what they hold as wise personal and business policy and what they hold as wise public policy. It’s schizophrenic. It’s hypocritical. And they couldn’t care less as long as they keep winning.
Their zombie fraud got a shot at redemption in the Great Recession. From 1985 to 2007, Paul Krugman observed, the monetarists fell back from their hardline views of ~1980, which had been proven demonstrably false, and morphed into the softer “cult of the independent central bank. Put a bunch of bankerly men in charge of the monetary base, insulate them from political pressure, and let them deal with the business cycle.”15 The core beliefs of monetarism survived, swaddled in this looser policy cocoon.
When the Great Recession hit, monetarist theory got another shot at being proven right. One of monetarism’s core historical arguments, which was detailed in Friedman’s and Schwartz’s A Monetary History, was that the Great Depression wouldn’t have been nearly as severe if the Fed had applied the correct set of monetary policies. That problem had been fixed since Volcker got to the Fed, l-f-lib ideologues maintained, and the Fed of the 2000s was ready to deal with fiscal crises properly. In fact, that the Fed was armed with the monetarist playbook was used in the 1990s by Chicago Schoolers like Merton Miller to justify more financial system deregulation and more derivative trading on Wall Street (as chapter four chronicled).
The Independent Institute (II) is a run-of-the-mill l-f-lib think tank that’s based in Oakland CA. Its President and CEO, David Theroux, got an MBA from the University of Chicago and is on the board of the Libertarian Christian Institute.16 One of the II’s contributing authors is a Peruvian-born economist, Alvaro Vargas Llosa. Llosa has also frequently contributed content to The Libertarian Institute website, an outfit similar to II but that’s based in Texas.17 Llosa wrote a book on Latin American politics as well, which makes, per one reviewer, an “…essentially a free-market, libertarian argument…” regarding how economies in that region should be retooled. Llosa is an excellent stand-in for l-f-libs’ general ideological positions circa 2010.
In a late 2010 article, “The Return of Stagflation”, Llosa wrote that the world was “entering an era of high inflation, to judge by the massive growth of the money supply in the United States, Europe and Asia, and the stubbornness of central bankers who insist that high unemployment demands the creation of even more money. The last time the world went through a similar period was the 1970s. The term that defined the era was ‘stagflation.’”18 Here we go again.
Llosa then regurgitated the standard l-f-lib rewrite of history regarding the OPEC oil embargo period. Stagflation, Llosa wrote, “was the result of a recession partly caused by stratospheric oil prices followed by the decision to print tons of money in the hope of inflating the economy out of unemployment. In other words, stagnation was not so much because of oil prices; rather, it was the result of the monetary response to the stagnant environment that the high energy costs had helped create.”19 That zombie lie then led Llosa to dive head first into the bone-dry monetarist swimming pool:20
What is happening today is in essence not all that different. The response to high unemployment caused by the recession has been a massive increase of the money supply. Since the end of the housing bubble, the Federal Reserve’s balance sheet (assets and liabilities) has almost tripled.
Llosa’s prediction was that “Stagflation will likely come back into our daily lexicon. The political effect of the previous stagflation was the Reagan-Thatcher movement in the 1980s.”21 He then predicted the world was going to take another big step in the direction of the vindicated l-f-lib ideology as a result.
The Fed indeed printed an ass-ton of money to help make the TBTF MAGAbanks that induced the Great Recession whole, but inflation didn’t spike in late 2010, or for the rest of the decade for that matter.22 At no point from 1990 through 2020, in fact, has inflation in the U.S. topped 4%; inflation turned negative in 2009.23 How wrongheaded can you be? Reality spiked the football on monetarism’s grave, twice.
Despite all of the money printing by Bernanke’s Fed, the institution was unable, of course, to forestall the Great Recession. The weakened “cult of the independent central bank” had gotten a second big theoretical road test during the last year of Bush-Cheney administration and through 2010, and it failed, again. “Milton Friedman was wrong,” opined Krugman in 2010, “in the face of a really big shock, which pushes the economy into a liquidity trap, the central bank can’t prevent a depression.”24 Amen. Half the point of A Monetary History was that the Fed got it wrong in the 1930s, and when a supposedly ready Fed ran into similar circumstances in 2008 and applied the monetarist prescription, the Fed wound up presiding over the second worst recession in U.S. history. Friedman’s and Schwartz’s theory was entirely wrong.
Can you hear the cult chanting? “Monetarism is dead. Long live monetarism.”
Monetarism naturally violates the Arrow-Smith ideal. The first tenet states that ideal market containers consistently promote the creation of new healthy market agents and foster more competition across the spectrum of market agents. Monetarist theory doesn’t support countercyclical spending by governments in a downturn, especially if that support is biased towards SMBs and middle class and poor families, in violation of tenet #1.
Monetarism also violates the second governance tenet of the Arrow-Smith ideal, which is that market containers should establish and maintain an aggregate economic equilibrium, if not a surplus, with external market structures over the long run. You don’t want to run big deficits as a country, business or family for years and years and years. You’re doing something wrong if that happens. Something is amiss if your governance structure is consistently in the red and isn’t yielding a positive systemic ROI (governments’ public good multiplier effects should always be greater than its costs [the tax revenue stream] going into it).
As we’ve detailed, monetarists like Freidman don’t care about federal deficits (or international trade imbalances for that matter, a topic that we’ll revisit in later chapters) and never have – except when they’re useful marketing tools to “own the libs”. L-f-libs’ willingness to sweep large federal deficits and international trade losses under the rug when “their” leaders are holding the reins of governance power violates the second tenet of the Arrow-Smith ideal. They don’t have principles, they have hypocritical marketing tactics.
Based on these violations of the Arrow-Smith ideal, monetarism, of course, has also been a net contributor to rising U.S. inequality. The unholy union has won, on balance, from 1980 through 2021. That’s been a central theme of chapters four and five. Chicago Schoolers and their sugar daddies in the corporate realm have fought hard for decades to push up socioeconomic inequality and they’ve done it. The question is whether or not America will recognize the dangers and moral failure of allowing a high level of inequality to persist and make a severe course correction back in the direction of the Arrow-Smith ideal and wikicapitalism in the 2020s and beyond.
Let’s now go gut the other half of the theoretical Chicago School fish.
♦
For several decades after War II, George Stigler was l-f-lib theorists’ potent left hook to Friedman’s punishing right cross. Stigler advanced a microeconomic agenda that maintained that regulatory capture was a problem and the best solution to it was to curtail the government’s oversight activities and antitrust regulations, and that allowing more M&A deals between big businesses (and taking a more “free market” policy stance generally) was wise long-term public policy. These twin arguments fit together like puzzle pieces and square the with the l-f-lib ideological vision of the U.S. having a smaller and far more limited government.
So, how well have Stigler’s conjoined theoretical twins held up under the strain of real-world testing since 1970? We’ll start answering this question by first summarizing the opposing argument, which is that the Arrow-Smith ideal is a superior theoretical mousetrap and that if market-based economies with responsive democratic governments adhere to the Arrow-Smith ideal’s tenets, they’ll tend to outperform socioeconomically long-term.
In previous chapters, we’ve detailed how economists and related academics and philosophers dating back to the late 1700s, including Adam Smith, Charles Darwin, Louis Brandeis, John Keynes, Joan Robinson, Ken Arrow and Joe Bain, have collectively argued, broadly speaking, that social systems that have oligarchic or monopolistic characteristics tend to be weaker and less stable than social systems that have great competitive diversity and more equality across their pools of associated market agents, and that imbalanced power dynamics between governance systems and market agents, in aggregate, tends to be associated with deteriorating socioeconomic outcomes and less healthy competitive environments.
Supporters of the Arrow-Smith ideal and wikicapitalist public and private policy norms additionally argue that the monetarists’ core article of faith – that central banks hold the keys to the kingdom of steady and inflation-free economic growth – and that l-f-lib microeconomists’ twin articles of faith – that turning blind eyes to most M&A deals between big businesses and rolling back the rules governing private market agent competition yields superior long-term systemwide results – are wildly off the mark and dangerous. The l-f-libs’ theoretical free lunches aren’t free lunches, supporters of the Arrow-Smith ideal and wikicapitalism maintain, but are rather more akin to sugar rush highs or meth-fueled benders. A bill inevitably comes due for pursuing the high-inequality path, and the ultimate price paid for going down that path is higher than if the sugar rush high or meth bender was avoided in the first place. It’s a bad socioeconomic bet.
L-f-libs’ pro-M&A argument was succinctly summed up in 2007’s The Chicago School. “General opinion during the 1950s and 1960s held that the link observed between industry concentration and profitability was proof of market power and hence the setting of prices above the competitive level,” wrote Johan Van Overtveldt. “Not so, the Chicago School answer went, because companies grow big and profitable because they are efficient. If these companies tried to exert market power and raise their prices substantially, others would enter the market.”25
That’s a great encapsulation of the argument that Stigler et al advanced from ~1960 onward as it relates to their M&A-friendly stance on oligopoly firms. The advancement of their ideas led to an antitrust policy stalemate between the Neal Report and the Stigler Report. The Chicago Schoolers held that more M&A was fine because one rarely found above-average profit margins, even in highly-concentrated industries, because those markets had more competition in them than was implied in S-C-P antitrust enforcement model studies.
Stigler’s policy vision eventually gained the upper hand. Reagan’s DoJ and FTC switched from the S-C-P era’s four-firm concentration ratio approach to measuring market concentration to the somewhat more permissive HHI-based model in 1982. The Obama administration compounded that error by moving the Reagan administration’s HHI goalposts back another 30% in 2010, as we’ve noted.
The first figure in this ebook, chapter one’s figure one, used data from the IRS’s SOI group to illustrate how corporate profits have grown more concentrated among America’s biggest businesses between 1969 and 2006-07. The Gini coefficient for corporate profits rose from .52 to .7 over this period, according to the SOI’s corporate asset bucket definitions. This profit concentration trend is entirely consistent with Stigler’s pro-big business M&A agenda, and it’s consistent with the unholy union’s broader push to justify the concentration of socioeconomic power into fewer and fewer hands over time.
Toward the end of the last chapter, we traced revenue concentration trends in many of manufacturing’s largest industries dating back to the early 1960s in order to connect the dots between the S-C-P era’s tougher stance on antitrust enforcement (and the lower top four firm revenue concentration ratios that existed in that timeframe), and the Chicago School and unholy union era’s more lax approach to antitrust enforcement (and the subsequent rise, starting the late 1980s, in top four firm revenue concentration ratios). In chapter four we also noted some of the massive M&A deals that contributed to rising revenue concentration in the manufacturing sector.
Early in this chapter, we outlined the seven large M&A waves that have rolled through the U.S. economy since ~1900, and noted how the amplitude and frequency of these waves increased after 1980. We further chronicled several of the massive M&A deals that contributed to rising revenue concentration levels in the finance and insurance sector’s largest industries.
Let’s shift from this revenue-based view of market concentration to one that’s refocused on profits, since this approach should allow us to test whether the Chicago School’s or the Arrow-Smith ideal’s theoretical mousetrap has mapped better to the best available data sets in recent decades.
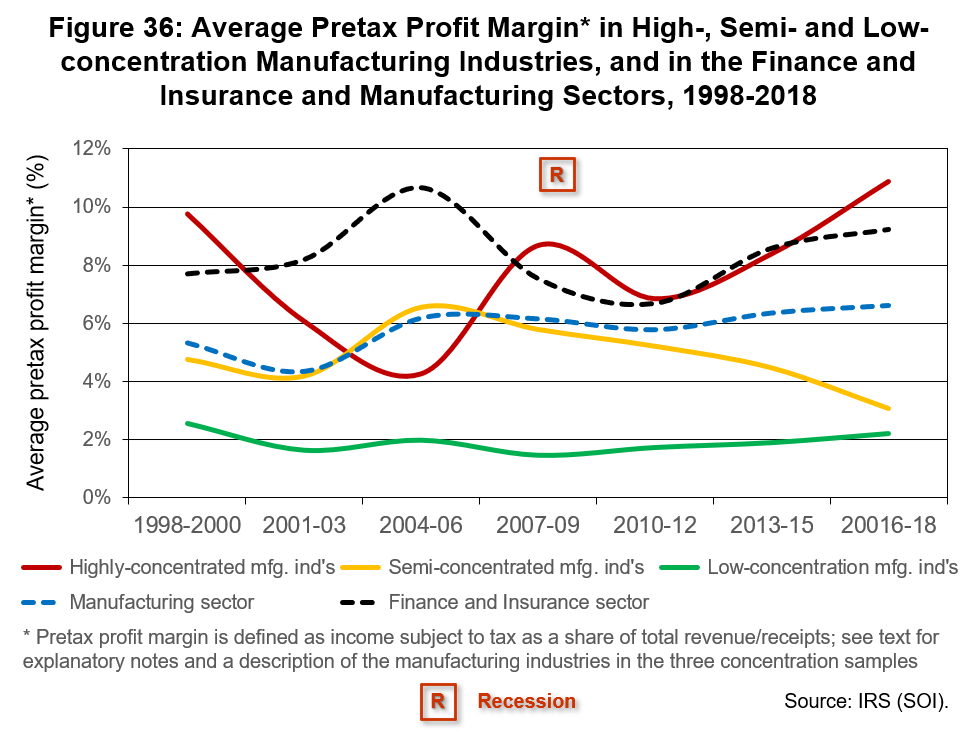
Figure 36 uses SOI profit data to illustrate the results of this test in the manufacturing sector (and the figure also includes some finance and insurance sector data that we’ll come back to shortly). The figure mainly reflects pretax profit margins in select manufacturing sector segments between 1998 and 2018. Annual SOI data were pulled and averaged in three-year increments in order to convey basic trends.
Pretax profits are here defined as the SOI’s income subject to tax results as a share of total corporate revenue/receipts results. The SOI publishes this data by minor industry, which can be lined up with the 4- and 5-digit NAICS codes from the Economic Census. The SOI data doesn’t include every minor industry, but enough of them are captured for pretax profit margins to be derived and segmented into groups of high-, semi- and low-concentration industries, as defined by the EC’s HHI results.
Look at figure 36’s red, gold and green solid lines. Those lines reflect weighted pretax profit margins in paired high-, semi- and low-concentration industries. The industries in figure 36 weren’t cherry picked. The industries chosen were those that (1) could be lined up across the SOI and EC data sets, (2) were the largest available as measured by EC revenues, and (3) had the most diverse HHI and top four-firm revenue concentration ratios as captured by the EC.26 Those were the sole criteria.
Figure 36 strongly suggests that Joe Bain and the S-C-P crowd got it right. Remember, the Chicago School theory was that high-concentration industries wouldn’t tend to have fatter profit margins than low-concentration industries because there was enough competition in these markets to keep oligopoly firms from extracting monopoly rents. If these entities abused their market power, l-f-lib theorists continued, and if these companies priced-gouged customers in order to pad their bottom lines, then more competitors would enter the market and force those oligopoly firms to cut prices, obviating the need for proactive antitrust measures by the government (justifying the second element of the Chicago School’s conception of microeconomics).
Figure 36 represents solid evidence that companies with profound market power do tend to abuse their market positions and have extracted above-average profit margins from their customers in manufacturing for at least the past two decades. That’s what the pretax profit margin gap between the red line and the green line in figure 36 figure strongly suggests.
The high-concentration sample blends the SOI profit results from the aerospace products and parts manufacturing minor industry and the tobacco manufacturing minor industry.27 Aerospace, typified by Boeing and Lockheed Martin, was much larger than tobacco (i.e, Altria Group and Philip Morris) through the years shown, and aerospace grew more quickly in terms of revenue generated – tobacco revenue, in fact, shrank between 1998 and 2018. The weighted HHI across these industries in 1997 was ~1,800, which was the cutoff line for highly-concentrated industries during Reagan’s second term. Their combined HHI dipped to ~1,600 in 2007 but moved back up over 1,800 by 2017.28 At no point in any of these years was top four firms’ share of revenue fall <62% in either industry (this combined share peaked out at 91% in tobacco).
The low-concentration sample’s green line reflects weighted average pretax profits in the printing and related support activities minor industry and the dairy products minor industry.29 The printing industry, typified by the companies that make you favorite books, magazines and newspapers, was consistently larger than dairy products by revenue (i.e., your favorite local milk, cheese and butter brands) in this period, but printing also shrank over time as daily product sales rose. The weighted HHI between these industries was ~80 in 1997, rose to ~180 in 2007, but then slid back near 130 in 2017. These industries, needless to say, fell into the HHI’s highly competitive market group. At no point in 1997, 2007 or 2017 did either of these industries’ top four firm revenue share go above 24% (it fell as low as ~10% in the case of printing). There’s no reason to think these industries are radically unlike highly competitive markets beyond manufacturing.
Between 1998 and 2018, it’s safe to say, there’s been a strong correlation between concentrated industries and higher pretax profit margins in U.S. manufacturing. The concentrated industry sample had a pretax profit margin that averaged 7.8% through this period. The comparable figure in the highly distributed industry grouping was just 1.9%. That’s a statistically significant gap, and it strongly suggests Stigler’s microeconomic theory regarding the harmlessness of large oligopoly firms was wrong. These companies do stick it customers because they can, because their customers have few alternatives to which they can turn.
Let me reiterate: monopoly is the death of capitalism. One of the key downsides of allowing monopolies is that they inevitably start price-gouging customers. From Adam Smith to Joe Bain, clear-eyed market observers have always reached this conclusion. That’s why the Arrow-Smith ideal’s governance structure is biased against big businesses. These entities need an equal and opposite counterweight or they’ll skew the entire system toward inequality, and erode the fundamental rationale for having a capitalist system. Inequality is not a free lunch tradeoff. What you lose, among other things, is systemic efficiency. L-f-lib’s can’t or won’t see that. That’s what makes them ideologues.
The solid gold line aggregates the pretax profit margins in two other large manufacturing industries: the automobile and parts manufacturing minor industry and the petroleum refining minor industry.30 These industries were larger by revenue than the other four assessed in figure 36, and both of them grew significantly larger through this period. Their weighted HHI fell from >1,300 in 1997 to ~1,030 in 2007, then fell to 740 in 2017. Taken together, these industries grew more competitive over time – and their combined profit margin shrank. Might it be that the “invisible hand” pushes markets toward thinner profit margins as competitive dynamics grow stronger? #SiSePuede.
The HHI in the semi-concentrated sample averaged ~1,000 across the years shown in figure 26. 1,000 was the HHI cutoff in Reagan’s second term for moderately concentrated industries. If you notice, the pretax profit margin in the moderately concentrated sample briefly moved above that of the concentrated industry sample. Other than this 2004-06 anomaly – a period in which big oil’s pretax profits surged and aerospace’s pretax profits took a hit – the gold line stays between the red and green lines. That’s what you’d expect if you’re looking for a correlation between more concentrated industry revenue and higher profit margins. The “middling” sample corroborates what the high- and low-concentration sample data show.31
The dotted blue line in figure 36 shows pretax profit margins for the manufacturing sector overall. That’s an even better proxy for the typical industry in that sector than the gold line. The dotted blue line and the solid gold line aren’t far apart, though, and they generally stay between the red and green lines. The sector results back up the Arrow-Smith ideal’s theoretical prediction: profit margins do tend to be fatter in more concentrated industries than in highly competitive ones. Stigler’s theoretical prediction doesn’t hold up.
Can you hear the #MAGAhead zombies chanting? “The Chicago School’s oligopoly firm harmlessness theory is dead. Long live the Chicago School’s oligopoly firm harmlessness theory.”
Figure 36 also vindicates another aspect of Arrow-Smith ideal: that more distributed markets tend to be more stable. Look at how the profit margin gyrated in the red line versus the green line through the Great Recession. The more distributed markets were far more stable on pretax profit margins.
Blow this result up to the scale of the U.S. economy and you’ll begin to comprehend the size of the high-inequality instability bomb that America has rearmed since the Great Recession. We haven’t turned the ship of state in the direction of the Arrow-Smith ideal and wikicapitalism since 2008. The waviness of that red line is basically a TBTF bailout warning flag.
Let’s now bring the finance and insurance sector’s pretax profit margin results into the discussion. Those results are shown in figure 36’s dotted black line. I tried to find some similar minor industry pairings within the sector to test the same premise as was detailed above in manufacturing, but I wasn’t able to come up with enough industry candidates with wide HHI spreads to test the same profit margin thesis. The finance and insurance sector doesn’t have as many minor industries as manufacturing and the SOI data has some big holes in it, making such a test impossible as far as I was able to determine.32
The SOI data nevertheless suggests two things about the finance and insurance sector: its firms tend to generate higher pretax profit margins than do manufacturing firms, and the margins in finance and insurance tend to be less stable than manufacturing’s margins.33 The more concentrated sector, finance and insurance, was less stable from a pretax profit margin standpoint (the dotted black line is wavier than the dotted blue line), a finding that squares with Arrow-Smith ideal theory as well. Pretax profit margins in finance and insurance spiked, in aggregate, in 2004-06. That bump partly reflects Wall Street’s glory days while it primed it’s derivative-laden subprime mortgage bomb. Profit margins then tanked through 2012. They’ve since recovered and have actually surpassed the margins that existed in the early 2000s.
America hasn’t fixed its market concentration problem in finance and insurance since the Great Recession. Figure 36’s rising pretax profit shares in finance and insurance put an exclamation point on that take.
In 2009, Harvard Business School professor David Moss reviewed what triggered the Great Recession and he fingered the huge institutions at the apex of America’s private financial system:34
The rise of these massive institutions represented a profound change in our financial system and a powerful new source of systemic risk. We didn’t update our regulatory policies in response…[P]erhaps the biggest culprits of all were the supersized financial institutions. At root, this was a crisis of big institutions.
Our TBTF financial institutions are now larger than before the financial crisis thanks to the diligent work of unholy union forces.35
Finance and insurance aren’t like other sectors of the U.S. economy. This is part of what Ken Arrow underscored in his 1963 paper on health insurance. Money is the lifeblood of capitalism, and the main business of finance and insurance revolves around money itself. It’s like a snake eating its own tail. This isn’t true of the markets for shoes, cookies or gardening services. If your blood gets tainted, you suffer as an entire being because blood flows throughout your body.
In chapter two we noted how financial markets, like the markets that support national defense and security, need to have an extra layer of security and oversight surrounding them because they’re so systemically important, according to the Arrow-Smith ideal. A few “bad apples” there and your economy goes haywire or you lose a war.
Deregulation in finance and insurance is a particularly pernicious violation the first and second governance tenets of the Arrow-Smith ideal. If too few firms there hold too much market power for efficient capitalism’s own good, your entire society is at risk. Entirely innocent parties can get buried by their malfeasance. You can wind up with a supersized national debt and slew of negative multiplier effects, if and when those potent market agents fly off the rails.
America’s unholy union-backed bet that increasingly massive, concentrated centers of private financial power will deliver positive long-term systemic results has proven to be fundamentally flawed.36 That’s the inescapable lesson of the Great Recession. Even Alan Greenspan and Paul Volcker eventually came around to the notion that America’s TBTF financial firms needed be broken up in the wake of the Great Recession.37
We’ve implied in this chapter, using the best available scientific methodologies and data sets, that the U.S. would be better off if it developed and implemented strategies that cut into its high and rising levels of income and wealth inequality. Let’s now amend that recommendation to stipulate that in the implementation phase of such an effort – in addition to passing legislation such as a national minimum wage law that would permanently lift fulltime workers out of poverty, of course, and directing the DOJ and related agencies to pursue every legal means of curbing if not overturning state-level “right to work” laws – that revitalizing the competitive dynamic in both the finance and insurance subsectors is at the top of the priority list.
The Neal Report, as chapter four noted, sought the “reduction of concentration such that the market share of each oligopoly firm in such oligopoly industry does not exceed 12%” within four years of a given market being deemed oligopolistic by the DOJ and FTC. 36% of industry revenue works out to an HHI of roughly 500. (For example, the securities brokerage industry – one of the finance and insurance sector’s top ten largest industries by revenue in 2017 – had an HHI of 516, and its top four firm revenue share was 37%.)
If the DoJ/FTC were to update its antitrust policies to roughly align with the Neal Report’s HHI target, and applied that standard to the ten largest industries in finance and insurance, then executive teams in two other industries would receive divestiture orders: those in the credit card issuing industry and those in the investment banking and securities dealing industry. That sounds like a pragmatic place to begin unwinding the next TBTF financial system bomb. Let’s begin the pivot back towards the Arrow-Smith ideal by ordering all of the top ten industries in finance and insurance, as measured by revenue, to get their HHI’s <500 within four years.
If America similarly redefined moderately concentrated markets to those with an HHI between 300 and 500, then top dogs in four other top ten industries in finance and insurance would be put on notice that future M&A deals would be challenged in court if they substantially raised HHI. Direct health and medical insurance carriers, direct property and casualty insurance carriers, direct life insurance carriers, and sales financing all had HHIs in the 300-500 range as of 2017. The highest among them was home to Medicare’s and Medicaid’s HMOs and MCOs, at 429. No more massive M&A deals in the direct health and medical insurance carrier industry, thank you very much.
In “Are U.S. Industries Becoming More Concentrated?”, professors Gustavo Grullon, Yelena Larkin and Roni Michaely used Bureau of Labor Statistics (BLS) and Compustat data to see if there was a link between rising revenue concentration levels and higher industry profits across a wide range of U.S. industry groups. The trio calculated the return on assets (ROA, another standard measure of profitability) of >143,000 large businesses between 1972 and 2014. To calculate ROA, the professors pulled these company’s operating incomes before depreciation from Compustat and scaled that figure by their book value of assets. ROA was then used as a dependent variable, and a regression analysis was run against the HHI of these firms’ industries (the HHI data was sourced from the BLS’s three-digit NAICS codes in all markets except for financial services and utilities since the professors found some unusual properties in those markets that made associated calculations apples-to-oranges).38
The result of the professors’ test was unambiguous. Between 1972 and 1986, the period corresponding to the end of the S-C-P era and the start of the Chicago School’s and unholy union’s “free market” era of deregulation, the relationship between rising ROA and rising HHI was slightly negative.39 This implies that the more stringent antitrust measures that existed in that era kept a lid on companies that tried to use their market power to drive up ROA (profits). From 1987 to 2000, the same test showed a weakly positive relationship between these variables (results were within the margin of error and statistically insignificant). This implies that while a M&A wave occurred in the ‘90s, a decade in which many big businesses grew far larger by revenue, the scale increases didn’t generally translate into fatter profit margins (higher ROA).
That changed dramatically between 2000 to 2014. The correlation between ROA and HHI in this third period considered by the professors turned strongly positive. The significance level, in fact, dropped to 1%.40 That meant that there’s a 99% chance that these two factors were related.41
Gimme a break. Stigler and the Chicago Schoolers were wrong. Since 2000, there’s been a deep connection between rising ROA and rising HHIs within a clear majority of U.S. sectors. A real-world test by professors Grullon, Larkin and Michaely confirms that the Arrow-Smith ideal is the better theoretical mousetrap. It’s prediction regarding price-gouging behavior by oligopoly firms and quasi-monopolists is evident in the data.
Can you hear their mantra too? “The Chicago School’s oligopoly firm harmlessness theory is dead. Long live the Chicago School’s oligopoly firm harmlessness theory.”
Enron clearly price-gouged the people and companies of California circa 2000. In this chapter, we’ve documented how HMOs, MCOs and pharmaceutical makers have stuck it to the U.S. taxpayer for decades based on their overly juicy CMS contracts (courtesy of their unholy union comrades). Don’t forget about Martin Shkreli, the former CEO of Turing Pharmaceuticals, who bought the rights to the antiparasitic drug Daraprim in 2015 and promptly jacked its per-pill price up from $13.50 to $750.42 That guy’s still in prison for securities fraud. Our figure 36 analysis further implied that aerospace companies and cigarette makers have been screwing their customers on the price front for decades to boot.
Then there’s what happened on Wall Street since 2000. Companies in that market stuck it to millions of new U.S. homeowners by incentivizing lenders to offer these people and families mortgages that contained deceptively low “teaser” rates that reset at higher rates a few years later, leaving those people and families incapable of paying their mortgages. Let’s be clear: the vast majority of subprime mortgage recipients who signed those “teaser” rate contacts would not have been approved for their mortgages if the post-reset monthly payment estimate was used in their initial paperwork. The whole thing was an immoral scam. Thanks #unholyunion. That massive, money-vacuuming scheme was the direct result of deregulation.
We won’t even go back into the LIBOR scandal. Suffice to say that some of the same MAGAbanks that abused their market power in the subprime mortgage space were engaged a parallel scam in the 2010s that screwed parties on the other side of those derivative bets based on collusive LIBOR rate rigging.
Gimma a break. Stigler and the Chicago Schoolers weren’t just wrong in theory, they’ve been proven wrong in practice by every means science has at its disposal. That’s why the science gets jettisoned. That’s why they’ve systemically rewrote history. It’s never been about being right. It’s only ever been about winning in the real world. Nothing says “you’re a winner” in the real world quite like seeing your bank account balance go up as everyone else’s falls.
There’s one last vestige of Chicago School microeconomic theory that still needs to have a stake driven through its heart: the Coase Theorem. In the middle decades of the 20th century, that theory was used to posit that private parties could efficiently perform governmental functions, such as the resolution of legal disputes and FCC-type auctions, if certain market conditions were met.43 The idea proved to be catnip to Friedman and rest of the small, limited government crowd.
Coase’s subsequent attempts to prove his theory held up under real-world conditions proved fruitless.44 Near the end of his career, in 1991, he raised the white flag, writing, “It makes little sense for economists to discuss the process of exchange without specifying the institutional setting within which the trading takes place since this affects the incentives to produce and the costs of transacting.”45 That mealy-mouthed word salad is as close to a mea culpa as you’ll get from a Chicago Schooler who doesn’t want to be excommunicated.
Don’t worry, I gotcha covered. “The Coase Theorem is dead. Long live the Coase Theorem.”
Whenever l-f-lib theories disintegrate in front of their proponents’ faces, they always have one last zombie lie trump card that they can fall back on and drop on their opponents: you’re a commie socialist. Your ideas failed in the 20th century. “Free market” capitalism won, so we can’t be wrong, libtard. You’re the one that needs to go back to the drawing board. In the last chapter of Book I, we’ll blow that that l-f-lib myth out of the water – and challenge a few other widely held misconceptions about how history unfolded along the way. Hope you’ve got some popcorn.
References