The combination in the shift in attention to efficiency, and the restoration of the powerful role of competition, has done much to weaken the arguments for an antitrust policy that seeks to deal with minor or transitory or (as in the case of vertical integration) erroneously identified monopolistic practices.
– George Stigler
Before delving into the triggers and consequences of the Great Recession, it’s useful to stand back and fully appreciate the rollback of Arrow-Smith ideal-related norms and document with finer precision how competitive dynamics at the apex of many large U.S. industries have become weaker since 1970. It’s difficult to find someone who personified the effort to roll back these norms and to weaken competitive standards than Milton Friedman’s ol’ pal, George Stigler.
George’s parents, Elsie and Joseph Stigler, were of German stock. Born in Seattle, Washington in 1911, George studied at the University of Washington and received his MBA from Northwestern in 1932.1 He then got a doctorate in economics from the University of Chicago late in the Great Depression years, and his dissertation supervisor there, Frank Knight, wound up having a profound effect on Stigler’s views and life’s work. It was in this timeframe that George also met and befriended Milton Friedman. Both men met their future wives while at the University of Chicago. Stigler married Margaret Mack in 1936. The couple had three sons in the ‘40s.
After teaching and working in Minnesota and in a few other spots, Stigler returned to the University of Chicago in 1958 and practically spent the entire balance of his career there. The Stigler family enjoyed summering on the banks of Canada’s Muskoka Lakes, and George was an avid book collector.2 His library probably contained signed first edition copies of A Monetary History and The Way the World Works. Stigler won a Nobel Prize in economics in 1982, and Ronald Reagan himself gave the man a medal in ’87. George died in 1991 at the age of 80.
The Chicago School delivered a potent 1-2 punch in its heyday. Ironic given their height disparity, Stigler was dubbed “Mr. Micro” while Friedman was known as “Mr. Macro”.3 Friedman’s primary impact on the field of economics came in the form of monetarism, which battled Keynes’ macroeconomic theories and its policy fallout, and in the final analysis, monetarism dealt serious damage to Keynesianism.
As the “Neal Report” description toward the end of Chapter 3 outlined, Stigler’s main focus was microeconomic theory and practice, and in a practical sense that meant throwing acid on the ideas underlying the federal government’s apparatus that protected and reinforced competitive dynamics at the apex of large industries. That’s how the dynamic duo worked its magic in its heyday: Friedman threw haymakers at the federal government’s head and Stigler worked the body with quick, precise jabs.
Stigler’s and Friedman’s efforts were, of course, carefully choreographed. Their favorite professional activity, besides toasting each other at MPS soirees, was advancing the cause of their mutually beloved l-f-lib ideology.
In the late 1990s, the federal government put Microsoft under its antitrust microscope, and Stigler’s impact on Friedman surfaced in an interview Friedman gave to the Cato Institute while that case was making headlines:4
My own views about the antitrust laws have changed greatly over time. When I started in this business, as a believer in competition, I was a great supporter of antitrust laws; I thought enforcing them was one of the few desirable things that the government could do to promote more competition. But as I watched what actually happened, I saw that, instead of promoting competition, antitrust laws tended to do exactly the opposite, because they tended, like so many government activities, to be taken over by the people they were supposed to regulate and control. And so over time I have gradually come to the conclusion that antitrust laws do far more harm than good and that we would be better off if we didn’t have them at all, if we could get rid of them.
Friedman swallowed Stigler’s regulatory capture arguments hook, line and sinker. It sure helped that these “fixes” were perfectly consistent with the l-f-lib ideology. Stigler’s oft-repeated solution to the real problem of regulatory system capture by big businesses was to get rid of the antitrust laws and other measures that the government had adopted in the #progpop, New Deal and S-C-P era timeframe to protect markets from tampering by potent, self-interested private market agents. Stigler carried out his part of the “big government” rollback 1-2 punch effort with aplomb from mid-1950s through the late ‘80s.5
Given that we’ve covered the “Neal Report” and “Stigler Report” standoff around the time of the Nixon administration, we’ll instead reemphasize here that this specific skirmish was part of a larger struggle for microeconomic policy dominance that was joined by Chicago Schoolers on the one hand and supporters of the S-C-P paradigm of antitrust enforcement on the other.
Yale Brozen was a stand-in for Stigler in the annals of academic literature once the “Stigler Report” was leaked, stirring up a hornet’s nest of protest among S-C-P paradigm backers. Brozen arrived at Chicago’s GSB in 1957 and got involved with Stigler on antitrust and monopoly policy matters shortly thereafter. For over a decade after the “Stigler Report” leaked, it was primarily Brozen who defended the actions of oligopoly companies in the Journal of Law and Economics against countervailing evidence produced by supporters of the S-C-P antitrust enforcement model.6
Brozen challenged the idea that “structure determines conduct and performance” and instead posited that “conduct and performance are more likely to determine structure and that, in the absence of governmental intervention, structure will be forced by the market in the direction of efficiency.”7 This the #unholyunion’s antitrust response line in a nutshell: if the government would only get out of the way, competitive dynamics in large and concentrated markets would grow stronger over time. Brozen implied that more products/services, stiffer competition and lower prices would follow from the rollback of antitrust laws, policies and regulations.
Supporters of the S-C-P paradigm refused to take the illogical leap of faith that Brozen’s position required. The evidence he produced to back up his assertion was scant. It drove S-C-P paradigm supporters bonkers when, in 1982, Brozen wrote, “If a firm grows to where their market shares concentrate an industry or make one firm dominant, it must be because of superior management, economies of scale, or the production of better products that satisfy a major portion of buyers at a lower cost to them…Any attempt at monopolistic or collusive behavior requires restriction of output. Such attempts entail a consequent sacrifice of market share.”8
Chicago Schoolers like Brozen held that there was a free lunch of sorts to be had here: the government could dismantle much of its oligopoly and antitrust measurement and scale-reducing enforcement apparatus, and companies wouldn’t fill that new gap with anticompetitive activities because it was against their interests to collude or adopt otherwise monopolistic growth plans.
To supporters of the S-C-P model, this assumption didn’t simply fly in the face of U.S. history as well as numerous studies into this topic, but also contradicted the basic rationale of having businesses: to make money for owners. Why wouldn’t companies fill the void left over by regulatory pullbacks in concentrated markets with next-gen anticompetitive practices? Why would companies invest so much in lobbying, think tanks and PACs in Washington, DC if they didn’t think rolling back the norms of the S-C-P paradigm would yield tangible financial upsides?
To its critics, the Chicago School’s position was fanciful and dangerous. Their alleged free lunch was, in fact, a tradeoff. The dynamic involved near-term business/corporate interests and the public’s long-term interest in maintaining robust competitive dynamics at the apex of large industries because, absent adequate competition (1) businesses will gouge customers on price; (2) product/service variety and quality will deteriorate; (3) dominant market players will double down on regulatory capture investment efforts; (4) when these firms inevitably hit a wall, which they’ll rarely see coming due to a combo of hubris, laziness and/or incompetence, they’ll seek government bailouts – and the government will be tempted to pay up because there won’t be other competitors with scale that are ready to fill the smoking, rubble-strewn void left behind by the imploding businesses. Supporters of the S-C-P paradigm in microeconomics pointed to examples like the East India Company straight down to the “thrifts” in the S&L crisis, and later, to Enron.
John McGee was another Chicago Schooler. He drew the short straw on defending Standard Oil’s business practices. His review of the Progressive Era case against the Standard Oil Trust, to no one’s surprise, found precious little evidence of corporate wrongdoing. Concluded McGee, “…Standard Oil did not systematically, if ever, use local price cutting in retailing. Or anywhere else, to reduce competition.”9 An abuse of scale power, like dumping oil to weaken local competitors and then scooping them up at bargain prices, was precisely what the government found in its review of Standard Oil’s business tactics. That evidence was key to the company’s ultimate breakup into dozens of smaller suppliers in 1911, as chapter three chronicled.
Circa 1980, here was McGee, making a historical anti-antitrust case to justify the Chicago Schoolers’ contemporary positions. McGee recast the breakup of the Standard Oil Trust as of matter of governmental overreach. “Most kinds of predation that economists and historians have worried about are more costly to predator than to prey,” he wrote.10 Go it. Not only do companies not have an inherent reason to collude and try to monopolize their markets, it backfires on most of these companies if they employ such strategies.
Companies typically shy away from making more money, right? America’s apex predators weren’t lions, they were angelic vegans, according to Chicago School doctrine. They fight up through the ranks of a competitive environment but then push themselves away from the dinner table as soon as they punch their tickets to the bottomless buffet round. “No dessert for me thanks, Ethel.”
McGee’s 1980 paper is the fourth example of how Chicago Schoolers attempt to rewrite history whenever it flies in the face of their preordained ideological convictions. If the government isn’t the bad guy in their narrative, remember, they never get read in on the secret MPS handshake.
1980, of course, was the year that OPEC, an honest to goodness international ring of colluding corporations and the authoritarian governments that controlled them, ran roughshod over the U.S. economy and exacted vengeance through stagflation. That’s the year McGee climbed out on the Chicago School limb to throw buckets of white paint on the good ol’ U.S.S. Standard Oil. You gotta give it to the Chicago Schoolers in one sense: their ability to not see facts rubbed straight in their eyeballs is tremendous.
Arnold Harberger carried buckets of Chicago School whitewash too. He tried to undercut S-C-P oriented regulations as early as the 1950s, in fact. A Harberger paper, “Monopoly and Resource Allocation”, found that, “…eliminating all monopolistic elements in U.S. industry would increase consumer welfare by…less than one-tenth of 1 percent of the national income.”11 There it is in black and white as far back as 1954: a Chicago Schooler arguing that monopolies are a tiny problem in the U.S.
Mainstream economists pushed back on this idea circa 1975 in the form of William Comanor and Robert Smiley. Their review of monopolistic business activities from the Gilded Age through 1962, published in the Quarterly Journal of Economics, found that the amount of excess profit generated by these businesses was between 2% and 3% of U.S. GNP.12 That turns out to be a lot of dough. In 1975, 2.5% of GNP was ~$46 billion, or $222 billion in 2020 dollars.13 Harberger’s estimate was 20 to 30 times below what establishment economists concluded two decades later. A Chicago Schooler who lacks biased math, let’s remember, doesn’t get read in on the secret MPS handshake.
The positions of Stigler et al nonetheless began getting traction in the courts in the late 1970s. Two prominent decisions included Continental TV v. GTE Sylvania and Brunswick Corp. v. Pueblo Bowl-O-Mat. The former case accepted a broader view of efficiency that more heavily weighed the upsides of business scale, while the latter case raised the bar of proof on parties who were alleging injury due to peers’ anticompetitive practices.
The government stopped challenging nearly all vertical integration proposals (conglomerate mergers) once Ronald Reagan moved into the While House, and the green light on horizontal/competitive acquisitions started flashing with greater frequency as well.14
The Reagan administration put out new merger guidelines in its first term, new vertical restraint guidelines in 1985, and antitrust reforms went into effect in ’86.15 All these changes moved the ball downfield for team Chicago. They’re part of the #unholyunion winning streak since 1970. The S-C-P paradigm was further undercut by Reagan’s budget reductions to the FTC; those cuts limited the agency’s ability to pursue antitrust cases and fully enforce the laws that were still on the books.16
It took a decade or so, but the recommendations contained in the “Stigler Report” gained the upper hand in practice in the ‘80s. America is still digging a deeper hole in this area of the law and regulation. From the perspective of wikicapitalism, this shredding of the S-C-P paradigm is one of the most underreported stories of the past fifty years. It’s been a key contributor to rising socioeconomic inequalities. Team Stiger won.
The rollback of Arrow-Smith ideal norms and practices did produce near-term gains for many large, private sector market agents. Those companies flooded the deregulated market gaps opened up by microeconomists like Stigler, just as supporters of the S-C-P paradigm warned these companies would do. That change did produce more near-term money for businesses with great scale in particular.
The Chicago Schoolers have consistently denied or swept under the rug any and all evidence pointing to long-term systemic downsides that have flowed from this sugar rush high growth strategy, however. There’s no free lunch to be had from a societal standpoint in the long-term. The Chicago School’s antitrust relaxation tonic is really a devil’s bargain, a green light to go on an extended meth-fueled bender. This what the financial crisis of the 2000s makes clear in full technicolor glory, as we’ll see in chapter five. You can lie to yourself, but in the long run you can’t fool Mother Nature because her laws governing competition are absolute and unforgiving.
From his view on the bench of the U.S. Court of Appeals, Richard Posner was tickled pink to see how “…antitrust enforcement was gradually pruned back” during William Baxter’s tenure at the head of the DOJ’s antitrust division in the early 1980s.17 Posner was no doubt equally pleased to see the Supreme Court raise the evidentiary bar further on plaintiffs alleging injury based on antitrust laws in 1986’s Matsushita Electrical Industrial Co. v. Zenith Radio Corp. ruling.
A prominent antitrust case that had emerged in the 1970s involved IBM. Baxter’s DOJ criticized that case and dropped it in 1982.18 Many observers nonetheless maintain that the legal pressure that was applied to IBM in the ‘70s allowed indie software development companies to gain a foothold in that space, which led to a broader separation of operating systems, applications, and hardware in the ‘80s. That dynamic still characterizes the PC market today – one of the most incredible hotbeds of high-tech innovation the world has ever seen.
Reagan’s DOJ and FTC didn’t entirely lay down its antitrust hammer in the ‘80s. In 1984, the Sherman Act was used to break AT&T up into seven regional “Baby Bells” (RBOCs). In many ways, the #progpop, New Deal and S-C-P era of anti-oligopoly, -monopoly and -trust enforcement began with the high-profile, high stakes case of the Standard Oil Trust and ended with the dissolution of “Ma Bell”. There were precious few government-driven breakups of big businesses in America before that point and precious few since.
Today, AT&T, Verizon, Lumen Technologies, and other companies have emerged from the ashes of the old AT&T monopoly, which utterly dominated the nation’s local and long-distance phone networks for decades (and was found guilty of illegally subsidizing its network by repurposing monopoly profits from its Western Electric subsidiary, which manufactured nearly all telecom equipment in the U.S. prior to the breakup).19
The federal government changed how market concentration was measured in the early 1980s. The S-C-P model historically used concentration ratios (as described in the latter half of chapter three), and the government’s new approach used the Herfindahl-Hirschman index, or HHI. The metric got its name from a pair of economists who developed similar indices in the same timeframe. One was an American, Orris Herfindahl, and the other was a German émigré, Albert Hirschman.20
The HHI involves square roots and sums of squares of market share. The bottom line for our purpose is that HHI is a more nuanced and accurate approach of measuring market concentration relative to the older, simpler concentration ratio approach, although both point in the same general direction. In and of itself, the HHI is a better yardstick.21
The more important change in the early ‘80s was that the market concentration goalposts got moved back somewhat, even as they were reformulated with updated materials. After the 1982 policy change, the HHI allowed some M&A proposals to pass muster that the S-C-P model wouldn’t have permitted in its heyday, since it limited the revenue share of the four largest market players to 75%.22
HHI is generally measured on 0-10,000 scale. Results may be alternatively displayed as a percent or as a fraction of one (with two or three decimal points shown, as I’ve generally done with Gini coefficients in this ebook). An HHI near zero denotes almost perfect dispersion of market revenue across private sector market agents (and squares with the Arrow-Smith ideal’s perfect competition model). A score near 10,000, conversely, means that a market is almost perfectly monopolized.
After 1982, the DOJ’s new normal was that markets that had HHI’s over 1,000 were moderately concentrated and markets with HHI’s over 1,800 were highly concentrated. A market with four firms that each have revenue shares of 30, 30, 20, and 20 percent has an HHI of 2,600.23 If that market was large by revenue generated, if one of company tried to buy another in that space, the proposal would be challenged by the DOJ/FTC.
Once the HHI change was made, a wave of M&A deals swept through the U.S. economy. This mid- to late-1980s wave mainly consisted of buyouts in petroleum-related markets, credit markets, and in select manufacturing industries (food, textiles, and a few others).
U.C. Berkeley’s Joe Bain, now the aged lion of the S-C-P paradigm support group, watched this M&A wave rise with concern and stood up to defend his life’s work and robust U.S. competitive dynamics. His response to the Stigler arm of the Chicago School’s 1-2 punch came in the form of perhaps the most vitriolic broadside that has ever graced the pages of academic literature, which we’ll explore next.
♦
Dr. Joe Bain’s response to the real-world progress made by Stigler and company arrived in 1986. “Structure Versus Conduct as Indicators of Market Performance: The Chicago-School Attempts Revisited”, was Bain’s last, great attempt to save the S-C-P model of anti-oligopoly theory from ruin at the hands of Stigler et al.
Allow me to get out of way and quote liberally from Bain’s heat-seeking missile, which came thoroughly drenched in dripping distain:24
[One group] has been called the “classical school” and emphasizes relationships of leading aspects of market structure to market performance among industries, although it has examined and measured market conduct and performance at least as deeply as any opposing faction. “Structuralism” as applied to it is an epithet from an epithet factory. The other party…[is] the “Chicago school” of industrial organization, more precisely Professor George Stigler as backed in sparse writings by Professors Yale Brozen and Harold Demsetz…Briefly, this Chicago school attacks, rejects, or simply neglects the relationship of market structure to market performance. As an alternate, it has periodically emphasized market conduct as the true determinant of performance and shies away from suggesting any general explanation of such performance…
[S-C-P or classical school theory maintains that there’s]…a step-function relation of profit rates to seller concentration. Increases of seller concentration from a low level to a critical level (to be determined) are accompanied by roughly unchanging industry profit rates but seller concentration above that critical level is accompanied by significantly higher industry profit rates…
[Classical school theories also maintain that significant barriers to market entry exist and that all]…the major sources of these barriers may be classified so as to fall in one of three categories: (1) Economies of very large-scale production [meaning that it’s hard for small/new companies to reach the lowest long-run average cost of production]; (2) absolute-cost disadvantages of potential entrants [meaning that smaller/newer companies may lack the superior tech of incumbents, which is often protected by patents, or smaller/newer companies may not be able to access land or other raw materials incumbents control]; and (3) product-differentiation disadvantages of potential entrants [meaning that incumbent differences in quality, design, ad effectiveness, and reputation may constitute a material advantage versus small/new firms]. The total barrier to entry to any industry is essentially a vertical sum of the three sorts of entry barrier found in that industry.
Based on this logical model, which stemmed from classical economic theories and measurements dating back to Adam Smith, Bain and like-minded academics set out to test whether these theories held water in post-World War II America.
Using data collected by the government as well as public company filings, Bain and company conducted a deep dive into 30 industries between 1950 and 1960 and found a pattern indeed existed that was consistent with what the classical school theory predicted: profit rates on equity were higher, by a statistically significant margin, in high barrier to entry markets compared to low barrier to entry markets.
Bain et al therefore made a general statement about how capitalism functioned in the U.S. in the 1950s because the group of researchers had:
…offered empirical evidence which confirms the validity of these hypotheses, thus promoting them to the status of empirical generalizations concerning the determinants of a leading aspect of market performance among industries in general…[In contrast, marketplace] conduct is so difficult to measure, except in terms of the market performance with which it is linked, that it does not in general appear to be an independent aspect of behavior useful in developing scientific generalizations…
[The] Chicago school of industrial organization has tended to fall back on market conduct but it cannot be accused of developing any scientific generalizations concerning the relationship of market conduct to market performance for a whole population of industries…The position of the Chicago school of industrial organization has two main components, one being a rejection in whole or part of the major classical-school propositions concerning the relationships as among industries of seller concentration, entry barriers, and product differentiation to market performance – this within a methodology which features semi-isolated ad hoc arguments. The other is some sort of assembly of positive arguments which generally feature types of market conduct as explanations of market performance…
[Regarding the first proposition:] Even Stigler, distinctly the most prolific purveyor of Chicago-school doctrine, dissembles quite a bit before tackling classical-school findings head on. For example, in a brief essay on “The Measurement of Concentration,” he presents a rather scattered discussion of what he designates as “the classical theory of oligopoly,” [but he]…reaches no interesting general conclusions on oligopoly theory…
In a companion piece optimistically entitled “A Theory of Oligopoly,” Stigler essentially attempts to modify the theory of oligopolistic pricing…[He] slips in the alleged condition that true oligopolistic collusion requires true homogeneity both of sellers’ products and buyers’ purchase commitments, a claim that cannot be accepted simply because it has been vigorously asserted. The consistency of approximately joint profit-maximizing prices with product-differentiated oligopoly is amply supported by reams of evidence and by supporting theory. One gains the impression not only that Stigler is pathologically allergic to theoretical economic situations involving product differentiation but also has never studied very much actual market conduct and performance in differentiated oligopolies…
It is not entirely clear what Stigler’s main notions regarding the effects of buyer differentiation on sellers’ sales and profits have added to the corpus of existing oligopoly theory, particularly that part of it which might be empirically confirmed or disconfirmed.
Bain was here saying that Stigler’s alleged emperor wore no clothes. The leading Chicago Schooler had no “there there” when one pulled back the covers and looked at his scant empirical evidence.
Then Bain accused Stigler of professional malpractice based on his cherry picking of data in a 1963 paper, “Capital and Rates of Return in Manufacturing Industries”:
Its other-worldly quality becomes unmistakable if one reads concurrently Stigler’s source book on industry concentration – Concentration of American Industry – which contains all the relevant basic concentration data analyzed by Stigler, plus a roughly equal amount of at least equally pertinent data on concentration which he never mentions or incorporates in his analysis. What are overlooked are the identities and concentration ratios of the small multitude of Census 5-digit products, which compose the 4-digit Census industries. Inexcusably, Stigler never mentions product concentration data and does not include them in his analysis of the probable varying relation of Census 4-digit industry concentration to profit rates, although to have done so would have seriously revised his analyses and conclusions. The thoroughgoing student will recognize that, in this Stigler piece, he is dealing with a statistical snakepit as well as with the issues at hand…
The “finding” that the profit-rate difference between Stigler-concentrated 3-digit industries and Stigler-unconcentrated 3-digit industries was statistically insignificant had to be expected and was meaningless. These Stigler findings are those of a more or less mindless application of statistical techniques to suspect data and there do not appear to be any excuses.
Bain went on to accuse Stigler of reading far too much into a theory, developed by mainstream economists in the 1950s, that posited monopoly and oligarchy companies could limit their price inflation strategies based on different levels of market barrier to entry (meaning that companies will moderate their price gouging tactics in markets with low barriers to entry so as to not attract new competitors). Bain begins this demolition job by quoting a 1968 Stigler paper, “The Organization of Industry”.
“The ‘limit price’ theory of Bain, and subsequently Modigliani, is essentially a refurbished (sic) theory of potential competition.” The preceding is pure manure and Stigler presumably knows it. He mentions barriers to entry again only briefly in a 5-page chapter with assorted gibberish and no attention to the actual theory in question…
Bain then moved on to the Chicago School’s second (positive) proposition, blasting Stigler’s take on why some firms survive and others don’t. Classical school economists developed a means of estimating the relative efficiency of firms and relate that back to these firms’ scale and output, but Stigler et al published papers in 1950s and 1960s that ignored all this hard work and instead set forth:
…a handy-dandy shortcut which would allow any fool to substitute a sort of mindless exercise in organizing government published data on actual plant and firm size at arbitrarily chosen times. His position was succinctly stated in a related paper, as follows (italics added): “The comparative private cost of firms of various sizes can be measured only in one way: by ascertaining whether firms of the various sizes can survive in the industry. Survival is the only test of a firm’s ability to cope with all the problems: buying inputs, soothing laborers, finding customers, introducing new products and techniques, coping with fluctuations, evading regulations, etc…If a firm of given size survives, we may infer that its costs are equal to those of other sizes of firms…”
The list of actual reasons for the survival of firms with inferior (higher) social costs but lower private costs is of course practically endless, including, for example, (1) surviving with the support of large rivals; (2) securing hired factors at lower money prices; (3) entrepreneurial absorption of losses; (4) favored treatment or subsidy by government; and (5) holding a market through unfair trade practices. The real question, however, is whether Stigler took leave of his senses when he renounced social costs and adopted private costs as a measure of essentially social efficiency. Actually, he simply flew in the face of impressive mounds of contrary evidence when assuming off-handedly (and without any real defense of his position there or elsewhere) that there is free entry to “most American industries”…
It seems a pity to let all the gas out of the survivalability balloon after the trouble of blowing it up but then it would have been socially more efficient not to inflate it to begin with…
If you can’t hear Bain snarling behind each word in the above excerpt, you’re not paying attention.
He concluded his essay by observing that, on the merits of the math, logic, history and science, it’s a lopsided W for the classical school, but he also acknowledged that Chicago Schoolers never cared too much about scientific rigor – muddying the waters and giving cover to what some big businesses preferred was their goal all along:
The first main section of this essay explained how classical-school economists formulated hypotheses concerning the relationships of market structure to market performance and, so far as possible, confirmed these hypotheses with tests employing meaningful empirical data. The second section was given over largely to the Chicago school as it made as if to discredit classical-school postulates and findings, largely through vigorous assertions and misinterpretations of available data…
[Bain’s review of the Chicago School’s papers that relate to marketplace competitive dynamics showed that their alleged]…substitute was in part a scattering of articles particularizing about aspects of market conduct that were once prominent in antitrust actions or congressional discussions, plus a few ad hoc items on almost anything. If the resultant total seemed insufficient to the scholar seeking generalizations about the wellsprings of business performance, we must remember that the Chicago non-substitute for generalizations was just what the big business community and a libertarian federal administration wanted to hear.
I’ve quoted at length Bain’s paper, “Structure Versus Conduct as Indicators of Market Performance: The Chicago-School Attempts Revisited”, but I’ve failed to do his professional pantsing of George Stigler justice. I urge you to read the full essay if you’re at all interested in (1) seeing an academic level a virtual double-barreled shotgun at a colleague’s chest and pull the trigger; (2) appreciating the stunning dearth of hard science the Chicago Schoolers brought to the table at the intersection of microeconomic theory, competition policy and business performance from the end of World War II through the early Reagan years. It’s all been a mélange of smoke, mirrors, and muddying the water tactics. It’s the germ of what’s metastasized into QAnon and Trumpism.
Perhaps fittingly, Joe Bain died in 1991, the same year as Stigler. Let’s pause to pour one out for one of the fiercest defenders of the Arrow-Smith ideal in the late the 20th century. It was all for naught. Bain’s legacy was steamrolled and its bones are interred in the sands of time besides the “Neal Report.”
The demolition of the S-C-P model accelerated in the 1980s, hardly slowed in the ‘90s, and that crumbling process continues to this day. The #unholyunion outmaneuvered Bain and company in the real world. It’s been a clear scoreboard win.
Chicago Schoolers have never proved the classical school’s theories wrong, however, and they’ve never mustered the level of empirically-verifiable data needed to defeat the S-C-P model in a science-based fight. That theory still holds up to scientific testing, as we’ll shortly see. America has chosen to ignore this fact.
Judge Robert Bork was Reagan’s nominee to the Supreme Court after Lewis Powell – yes, the Powell who’s infamous USCC growth strategy memo was leaked – chose to retire. The Senate rejected Bork’s nomination in 1987, mostly along partisan lines. Bork grew quite bitter about the “liberal witch-hunt” that he thought derailed his career.25 Swimming deep in the Chicago School pool as he was wont to do, Bork wrote in 1993 that, “no firm size created by internal growth should be attacked by antitrust. The reason, of course, is that the achievement of large size by internal growth, whether the result is monopoly or membership in an oligopoly, demonstrates superior efficiency over the range of the market held.”26
From your lips to Stigler’s ears, Bob. Bork believed that some types of monopolies were okey-dokey. Shades of Arnold Harberger drift by. Bork was pleased to see vertical merger challenges go the way of the dodo. “Antitrust concern with conglomerate mergers seems to have disappeared without a trace. Although the government has a few guidelines about the circumstances in which it will move against vertical mergers, the guidelines are quite mild,” gushed Bork. “Horizontal mergers remain a subject of the law, as they should.”27 One can’t help but wonder if in the backroom meetings of their beloved Federalist Society if Bork and Posner quietly agreed that it was more like one pillar down, one still to go.28
The M&A wave of the 1990s mainly involved media, telecom, real estate, banking, and mining market consolidation. The union of Pfizer and Warner-Lambert, however, took home the decade’s M&A trophy at $90 billion. A less fruitful, larger union came the following year with Time Warner’s $165 billion buyout of America Online. Aww, just thinking about AOL’s dialup connection tone still warms my heart.
We earlier mentioned the antitrust suit filed against Microsoft in the late ‘90s, and it’s perhaps worthy of a brief recap. Microsoft had good reason to be concerned because the charge it was facing was quite similar to the one the government successfully used in the ‘80s to break up AT&T. Netscape’s free Navigator browser was a red-hot commodity circa 1995, although the company made most of its money by selling client-server software. Microsoft’s response to Netscape’s rise was to bundle its IE browser with its Windows OS at no additional cost.
U.S. attorneys and Netscape argued that Microsoft was subsidizing IE’s development and distribution with the profits of Microsoft’s lucrative Windows and Office business lines in violation the Sherman Act (because Microsoft was the dominant market player in the OS space).29 As Wired‘s Chris Anderson put it, since “the dominant company in the market has unmatchable ability to subsidize a free product with a paid one (on which they may be extracting monopoly rents), they have to be more careful in how they use Free.”30
The case also involved the question of whether or not Microsoft updated Windows in a way that made Navigator work less well on its OS. Microsoft was found guilty in 1999, and was ordered split in two. The case was overturned on appeal in 2001, however. By that point, Microsoft was dominant in the Web browser market, and the company ultimately paid a modest fine and changed Windows APIs so that third party browsers weren’t disadvantaged from a performance angle versus IE.31
The Census Bureau’s Economic Census (EC) is taken every five years. It collects data on millions of companies of practically every stripe and is an important, objective source of information regarding business sector performance.32 Like the IRS’s SOI program, the data collected in the EC is weighed so as to be representative of the businesses community as a whole, and its margin of error at an industry level is relatively low.
Bain’s science-backed pantsing of Stigler relied heavily on EC data. Bain accused Stigler of failing to drill down far enough into the Census data results, leading to intentionally imprecise, misleading results.
In the 1990s, the U.S. shifted away from the Standard Industrial Classification (SIC) system of business segmentation, which was developed in the Great Depression years, and embraced the vastly updated North American Industry Classification System (NAICS).33 In the U.S. today, the NAICS groups EC data into 20 sectors and, more finely, into ~1,100 separate industries. Sector and industry concentration ratios are measured using business revenue totals. HHI naturally made inroads as well into the DOJ, FTC and other government agencies (and into private sector orgs interested in assessing the quality of marketplace competition) starting the early 1980s, but the classic concentration ratio approach has proven difficult to shake, especially among parties interested in analyzing competition trends from before 1990.
I posited earlier that the #unholyunion has been the core driver of rising socioeconomic inequality in the U.S. since 1970, and that a hallmark of their ongoing winning streak has been the increasing concentration of business revenue (due to organic growth, more M&A deals involving market-leading firms, and the rollback of anti-oligopoly, -monopoly and -trust regulations). We’re now ready to follow Bain’s lead and use EC data to test whether or not the real world has continued to line up with his predictions since the early ‘80s.
♦
Figure 25 shows the share of revenue generated by the largest fifty firms in America’s eight largest economic sectors, as captured in Economic Censuses from 1997 to 2017. These sectors are also ranked in the figure’s legend in descending order of 2017 EC revenue. Wholesale trade came in highest at $8.73 trillion generated that year, for example, and manufacturing placed second at $5.55 trillion worth of goods shipped or sold. Retail trade came in third at $4.95 trillion. Finance and insurance ($4.34T), health care and social assistance ($2.53T), professional services ($1.84T), information ($1.58T), and administrative support, waste management and remediation services ($.95T) rounded out the top eight sectors.34
At nearly $2 trillion in revenue generated, construction would have made figure 25’s top eight, but that sector’s top 50 firm concentration ratio doesn’t appear to have been calculated prior to 2017, so that sector was excluded in favor of the next qualified sector down that did have this ratio calculated in the EC. Nine other economic sectors had revenues tracked in the 2017 EC and, including construction, they together generated $6.35T. That’s >$1 trillion less than the #1 sector, wholesale trade. Figure 25 captures the vast majority of economic activity in the U.S. in the past two decades or so, albeit filtered through the lens of the share if revenue that’s gone to the largest 50 companies in each sector.
The general trend in figure 25 is upward. The health care and social assistance sector pretty much treaded water in this period, and the information sector experienced a marginal top 50 firm revenue concentration ratio dip through ‘17, but the other five sectors in Figure 25 went up a little to a lot. The three biggest risers were retail trade (+13.2%), wholesale trade (+7.8%) and finance and insurance (+7.1%). The EC data strongly suggest big businesses’ share of revenue, on average, increased compared to SMB’s revenue share since 1997. This rise in concentration squares with the team #unholyunion win streak theory.
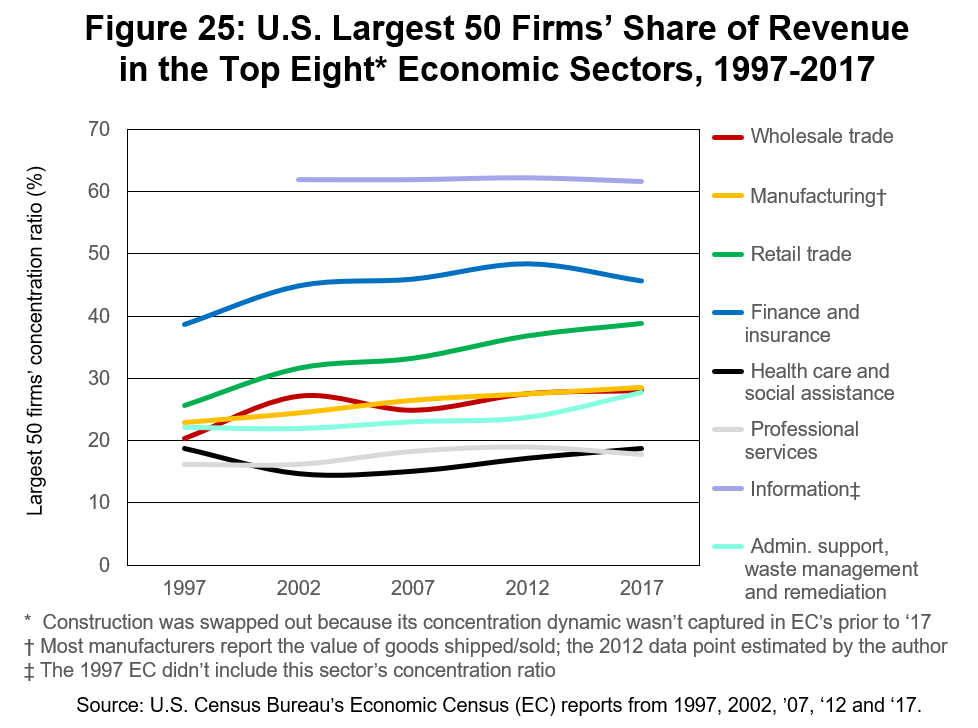
There’s noteworthy variation among America’s top economic sectors by this measure. Information may have come in 7th on the 2017 EC’s list by revenue, for example, but was #1 on concentration because >60% of its revenue was generated by the sector’s top 50 companies. If one looks further down the list of 17 EC sectors that had top 50 firm concentration ratios calculated in ‘17, though, one finds utilities came in highest on overall concentration, with ~71% of revenue generated by the top 50 firms. At the opposite end of the spectrum was the other services sector: its 50 largest businesses generated just 12.5% of revenue that year. A sector-based, top 50 firm share of revenue assessment is an imprecise tool by which to search for emerging oligopolies, but it offers a roadmap for prioritizing potential searches in this direction.
Of the 15 sectors that had concentration ratios calculated in EC’s in 1997-2017 (mining, quarrying, and oil and gas extraction was the other sector that didn’t publish such data prior to 2017), just four had flat or falling top 50 company revenue share results. The accommodation and food services sector had the biggest drop, at 1.9%, to 19.2% of revenue going to the 50 largest firms in 2017.
If we use an admittedly simplistic ±5% change benchmark to denote a significant revenue concentration delta over this two-decade span, then seven sectors qualified as significant changers and they all moved up. The other four positive movers not shown in Figure 25, or not already mentioned, were transportation and warehousing (+12.1%), utilities (+7.1%), administrative support, waste management and remediation services (+5.6%), and manufacturing (+5.5%). This finding is consistent with the “unholy union did it” theory of rising socioeconomic inequality: the general trend in the past two decades of available EC data show that big businesses have collected a greater share of revenues in their sectors.
That, in turn, throws the door open to rising income and wealth disparities in the general public because the wealth and income thrown off by big businesses isn’t close to being evenly distributed among the employees of these companies. Rising business revenue inequality has paralleled rising family income Gini coefficients in recent decades, as a comparison of figure 25 and chapter one’s figure two suggests.
Can our level of confidence that our “unholy union did it” theory holds water be increased, however? In a word, “Yes”. Let’s dive from a sector-based view of the U.S. economy down to an industry-based view.
The manufacturing sector isn’t one of the most concentrated sectors, nor was it a particularly fast riser in terms of top firm revenue concentration in the past few decades, but it has the advantage of having been closely tracked for an especially long period of time in EC surveys. If we’re able to gauge concentration in manufacturing’s largest industries during the S-C-P era, and then compare that to similar data from the #unholyunion era, if a significant difference exists, that would imply a critical aspect of capitalism has changed in the direction of inequality since the #unholyunion ascended to a position of public policy dominance.
Figure 26 starts to unpack this story. The figure shows the share of revenue generated by the largest four companies in manufacturing’s top eight industries, as measured by 1992 shipped goods value (which some companies alternatively reported as sales, receipts or revenue) in the 1963-1992 period. These numbers come from the EC’s 4-digit SIC codes. We’ll focus on the top four companies’ share of shipped goods value or revenue because that’s the finest resolution in the EC’s that allows us to gauge the relative performance of these industries’ “apex species”. If our theory is that “the biggest players got bigger faster” in the #unholyunion era than in the S-C-P era, then focusing on the top four players should give us a clearer signal inside the data set than a sector-based, top 50 firm view.
The order of the legend entries in figure 26 corresponds to the 1992 value of shipped goods or revenue by industry, per the EC. Aircraft manufacturing was top gun at nearly $63 billion. The top four market players there collected 79% of all industry revenue in ‘92. The industry’s HHI measure, a measure that was added to most manufacturing industries starting in the 1982 EC, went from 1,358 that year to 2,717 by 1992. Aircraft manufacturing moved from being a moderately concentrated market to a highly concentrated market per the DOJ’s/FTC’s guidelines in this period. No other industry in figure 26 qualified as even moderately concentrated in 1992 (the next closest were semiconductors and related devices, and bottled and canned soft drinks, which had industry HHIs of 541 and 537, respectively, in 1992).

A caveat regarding figure 26 should be relayed at this point. The EC contains a tradeoff for our purposes. One could reach further back into manufacturing’s EC data sets to, say, 1947, but because this sector’s 4-digit SIC codes were adjusted and expanded several times between the end of World War II and 1992 (due to market evolution/maturation), one would miss many large industries added to the EC’s after 1947. The 1963 expansion was particularly significant, for example, and it’s is why it was selected as the starting point for this S-C-P era baseline test.
Several other industries had gown larger than the eight shown in figure 26 by 1992. Those industries, however, didn’t appear in EC surveys until 1967 or later. Motor vehicle manufacturing, petroleum refining, and motor vehicle parts and accessories all generated more shipped good value in 1992 than did aircraft manufacturing, but those 4-digit SIC codes didn’t arrive until 1967, 1987 and 1967, respectively. That’s too late if we want a reasonably long S-C-P era baseline, which is the other half of the tradeoff.
Figure 26 isn’t a case of cherry-picked industries. It represents a reasonable balance between a long-run S-C-P era data set and being respectably representative of the manufacturing sector’s overall revenue trendlines.35 Figure 26’s industries delivered >$335 billion in shipped goods in ‘92, or >11% of the sector’s total. The industries shown also represented half of the sector’s 16 largest industries as measured by shipped goods value in 1992. The sample isn’t a small outlier.
With this caveat in mind, we’re now ready to interpret figure 26. There are two timeframes to consider in the figure. The cleanest S-C-P era sample runs from 1963 to 1982. The #unholyunion began getting serious traction in academic circles, began winning major anti-antitrust court cases and watering-down associated M&A regulations, grabbed the reins at the Fed, and ramped up lobbying intensity starting around 1980. Once the Reagan administration arrived in Washington, DC, as we’ve seen, it began to rewire a range of governmental processes in a manner far more amenable to #unholyunion interests.
As such, one wouldn’t expect to see deregulatory rollback effects in manufacturing’s largest industries until the 1987 EC data set at the earliest, and probably not until ’92 since there’s always a lag between laws and policies being changed and companies adjusting to take advantage of those shifts. If our theory holds water, only the two rightmost values in figure 26 correspond to the start of the #unholyunion era from a measurable standpoint.
If we again use a ±5% change threshold to denote a significant change between the 1963 and the 1982 results, four industries qualified in figure 26: newspapers (+7%), aircraft (+5%), semiconductors and related devices (-6%), and other industrial organic chemicals (-15%).36 That’s two up, two down, and the biggest changer was down.
Four industries qualified by the same measure from 1982 to 1992: bottled and canned soft drinks (+23%), aircraft (+15%), paper mills (+7%), and other industrial organic chemicals (-7%). That’s three up, one down, with the biggest changer upward. In no trained statistician, but I’d wager that revenue concentration ratio volatility in manufacturing’s largest industries rose between 1982 and 1992 relative to the two decades before that, and I’d wager the net effect of that volatility was to bend the revenue concentration curve upward for the four largest market agents in the latter period.
To doublecheck this assessment, I went back to the EC data set and identified all industries that generated >$10 billion in shipped goods value in 1992 and that had their top four firms’ concentration ratios calculated since 1963. That yielded a list of 36 industries. Together, they delivered >25% of the sector’s shipped good value in ‘92. Then I calculated a weighted average for these top four firms’ share of revenue.37 The net share change among the top four companies across these 36 industries from 1963 to 1982 was a drop of .6% (to 35.8% of total shipped goods value). In the EC years shown in figure 26, in just one of its four survey “hops” did the weighted average change >1% (it dropped 1.1% in 1982 versus 1977).
Between 1982 and 1987, this same weighted average rose 1.6% and rose another 1% through ‘92 (to 38.4% of shipped goods value across the 36 industries). This wider industry sample backs up our top eight industry take: volatility in the top four firms’ share of shipped goods value/revenue was lower in the S-C-P era than in the first decade of the #unholyunion era, and the direction of net concentration change was positive in the #unholyunion sample.
If one wanted to look for emerging oligopolies circa 1992, by the way, one could have done worse than look into aircraft and soda pop manufacturing. Did the big business M&A dinner bell ring more clearly in these industries after ’82? Without even checking the historical record my guess would be, “Yes”.
To the extent that we can show more M&A involved large market players and that these M&A deals contributed to rising top four revenue concentration ratios is the extent to which we can say with confidence that the “unholy union did it” theory holds up under the weight of empirical testing. The #unholyunion fought hard to allow the higher levels of business world concentration that emerged in the 1980s, and the net effect of their efforts showed up in the EC data sets.
The Census Bureau shifted to the NAICS measurement approach in 1997. That update made sense, but it also complicates our assessment of how industry-level competitive dynamics changed between the S-C-P and #unholyunion eras since the revisions to the manufacturing sector (and other sectors) were substantial.
Using six-digit NAICS industry codes, Figure 27 shows the largest four firms’ share of shipped goods sold in manufacturing’s top eight industries, per the 2017 EC survey results, and then traces those same industries’ top four firm’s revenue shares back to 1997. The righthand axis again denotes, in descending order, the value of shipped goods by industry in 2017. The petroleum refining industry grew massively over this period; it generated over $499 billion in 2017. The #8 industry, plastics material and resin manufacturing, generated $88.4 billion that year.38 Manufacturing’s top eight industries together generated >$1.37 trillion worth of shipped goods in 2017, a healthy 25% chunk of the sector’s total.
Let’s again apply our handy-dandy ±5% change litmus test to the results. From 1997 to 2017, five of the top eight industries hit this significant threshold: automobile manufacturing (-22%), light truck and SUV manufacturing (-21%), petroleum refining (+16%), pharmaceutical manufacturing (+8%), and animal slaughtering excluding poultry (+6%). That’s three up, two down, and with the biggest changer negative. It’s great to see that the auto, light truck and SUV manufacturing industries moved towards the Arrow-Smith ideal in this period. That was enough to keep a weighted average of the top four firms’ share of revenue in these eight industries roughly flat between 1997 and 2017.39

If one steps back to consider all the manufacturing industries from 1997 to 2017 that generated at least $40 billion in shipped goods in 2017, some 22 industries shake out the other side. Those industries collectively shipped nearly $2.19 trillion worth of goods that year, or >39% of the sector’s total.40
Using the same weighted top four market player calculation, the top four firms’ share of shipped goods sold in the 1997-2017 period rose 3.3% (to 48.9% of all revenue generated between these 22 industries). We don’t know what happened between 1992 and 1997 due to the SIC to NAICS switchover, but the top four firms’ revenue ratio did increase several percent in the #unholyunion era’s later sample if one considers this broader range of large industries.
On balance, more manufacturing industries grew more top heavy than not in this period. It’s the same trend that we saw in the first decade of the #unholyunion era, as figure 26’s rightmost values indicated. From 1997 through 2017, ten of manufacturing largest 22 industries saw their top four firms’ share of revenue rise at least 5%, while six industries saw a decline of >5%. From an HHI perspective, the same trend is clear. Sixteen of these same 22 industries had HHI’s calculated for their top fifty firms.41 Ten of those industries moved up on HHI, six moved down.
If we use the pre-2010 DOJ/FTC threshold for highly concentrated markets, which required an HHI of at least 1,800, then the number of qualified industries in manufacturing’s top 22 moved from three to four. Tobacco manufacturing and light truck and SUV manufacturing stayed highly concentrated in the 1997 to 2017 period, automaking fell out of this category, and aircraft manufacturing and petrochemical manufacturing moved up into it. The balance of EC data since 1997 suggests the “unholy union did it” theory is right.
You don’t have to take my word for it that business world inequities have increased in recent decades. Three professors of finance, Rice University’s Gustavo Grullon, York University’s Yelena Larkin, and the University of Geneva’s Roni Michaely, reviewed Economic Census data from 1997 to 2012 as well, and reached the same conclusion. Their 2018 paper, “Are U.S. Industries Becoming More Concentrated?” answered this question with an unequivocal, “Yes.”
The professors used much finer measuring tools than my ham-fisted ±5% change benchmark and weighted average top four firm revenue share calculations to reach this conclusion. Grullon, Larkin and Michaely reviewed EC HHI figures from manufacturing in the 1997-2012 period in their paper, but went a step further by reviewing the HHI’s of practically all available 3-digit NAICS codes (which correspond to economic subsectors).
The professors got right to it in the first sentences of their paper:42
In the last two decades, over 75% of U.S. industries have experienced an increase in concentration levels. We find that firms in industries with the largest increases in product market concentration have enjoyed higher profit margins and more profitable M&A deals. At the same time, we do not find evidence of a significant increase in operational efficiency, which suggests that market power is becoming an important source of value. These findings are robust to the inclusion of private firms, factors that account for foreign competition, as well as to the use of alternative measures of concentration.
The professors’ analysis found there was “an HHI increase in 76% of the manufacturing” subsectors reviewed between 1997 and 2012, and “the average increase in concentration levels has reached 90%.”43
My modest attempt to contribute to the body of research into the mechanics of competitive health in U.S. markets is this: if one uses the S-C-P era’s 4-digit SIC codes to run a comparable study of manufacturing concentration in the 1960s and 1970s, I believe a rising concentration trend won’t be found (based on my layman’s approach to estimating such things). Any such delta, I’d further argue, is the direct result of the #unholyunion winning streak. Stigler et al provided theoretical cover and then, beginning with the Reagan administration, successive federal administrations have, on balance, carried out Stigler’s marching orders. The “winners” of that process have been big businesses and their top shareholders.
Across practically all economic subsectors, Grullon, Larkin and Michaely continued, “the share of the largest firms has increased compared to industries in which the largest four firms became diluted by smaller peers. Moreover, a large proportion of the positive changes were extreme in magnitude: in 21 out of 65 industries the increase has exceeded 40%.”44 (In their paper, the professors used the term industry to cover 3-digit NAICS codes but I’m sticking to the more formal subsector term here because I think it’s important to differentiate grouped industries from fine-grained industries that use 5- or 6-digit NAICS codes.)
Grullon’s, Larkin’s and Michaely’s 2018 paper suggests that my rougher assessment holds up: more U.S. sectors have moved away from higher levels of competition than towards it in the past two decades, and the professors would add that this is true in the U.S. after the impacts of foreign competition are taken into account.45
“Big oil” has been one of the beneficiaries of this broad shift. In chapter three, we described how Standard Oil was torn asunder based on antitrust laws passed circa 1900, and earlier in this chapter we noted how Chicago Schoolers like John McGee did their best to shove the antitrust genie back in the bottle in the decades after World War II. Well, the Chicago Schoolers’ wet dream has largely come to pass.
America’s “seven sister” oil companies began to ooze back together in the 1970s. Standard Oil’s New York shard rebranded as Mobil in the 1960s, and it merged with Exxon in 1999 in a $77 billion megadeal.46 New Jersey’s Standard Oil shard rebranded as Exxon in ’73 and merged with Mobil. In one of the largest M&A deals in U.S. history to that point, Standard Oil’s California shard merged with Gulf Oil in ’84, rebranded to Chevron that year, and went on to buy Texaco for $36 billion in 2002 (forming the world’s fourth largest oil company).47 Marathon Petroleum was born from the ashes of Standard Oil’s Ohio operations. It snatched up substantive U.S. refining capacity from Husky Energy in ‘84, Ashland in ‘98, and Tesoro in 2018.48 Conoco was another Standard Oil breakup scrap; it merged with Phillips Petroleum in 2002 in a deal valued at >$15 billion.49
Out of what was once 34 companies in the wake of the 1911 dissolution of Standard Oil have come four Fortune 100 corporations as of late 2021, and most of the associated megamergers have occurred since 1980.50 The “big oil” reunion party is a microcosm of what Grullon’s, Larkin’s and Michaely’s research showed took place more broadly between the late 1990s and the early 2010s (and as the red line in figure 27 specifically illustrated in the petroleum refining industry through 2017). The M&A dinner bell has rung and rung and rung since 1980. That was by design, not accident. Stigler was arguably the most prominent l-f-lib’er to start clanging that bell consistently in the 1970s.
The resurrection of Standard Oil was just a warm-up act act, though, compared to what’s happened to the finance and insurance sector since 1980. The story of how that sector’s largest businesses went on a speed dating tear and then induced the Great Recession will be a core theme of chapter five. For now, let’s just set the table and offer an amuse-bouche over your left shoulder.
♦
Like all epic tragedies, the Great Recession had deep roots. The Depository Institutions Deregulation and Monetary Control Act of 1980 is as good a place to start as any. That legislation allowed banks and other lenders charge whatever interest rates they wanted and relaxed restrictions on mergers among the national banks.51 1982’s Alternative Mortgage Transaction Parity Act built on usury’s new found freedoms by legalizing exotic, often confusing financial instruments, including adjustable-rate mortgages (ARMs), balloon payments, and interest-only loans, which wound up playing a big role in the Great Recession.52
Americans met their first too big to fail bank in 1984. That year, the FDIC spent >$1 billion rescuing Continental Illinois, the nation’s seventh largest bank, which had made unwise loans. In congressional hearings about the bailout, Stewart McKinney, a Republican representative from Connecticut, noted that America had “new kind of bank. It is called too big to fail, TBTF, and it is a wonderful bank.”53
The Treasury Department later acknowledged the U.S was home to dozen or so of these wonderful banks. Nothing was done to purge U.S. financial markets of these walking, talking moral hazards. That was the second missed opportunity to forestall the Great Recession.
In 1986, Hyman Minsky published Stabilizing an Unstable Economy. A post-Keynesian professor of economics at Washington University in St. Louis, Minsky specialized in banking history. His book posited that banks were different from other types of companies because their contracts and related practices were so thoroughly enmeshed into all economic sectors, and because banks were unusually susceptible to boom and bust cycles.
Minsky’s book also underscored how the Great Depression era’s financial regulations were being watered down in the 1980s, and how that could lead to the destabilization of the U.S. economy because lenders and borrowers, in non-recession periods, tended to drift from hedging their loans and investments into increasingly risky and speculative lending/borrowing waters, and, ultimately, into unstable Ponzi schemes unless they’re checked by effective regulation.54 When this type of speculative bubble finally bursts, Minsky warned, the fallout tends to be epic. Banks that didn’t immediately implode would seek to protect themselves by pulling back on loans – even to businesses and people with great credit – thereby ensuring that a particularly long and deep recession followed.
What did Minsky recommend America do to head off this potentially massive instability bomb? Among other things in Stabilizing an Unstable Economy, he wrote, regulators and lawmakers should “keep the asset-equity ratio of banks within bounds by setting equity-absorption ratios for various types of assets. If the authorities constrain banks and are aware of the activities of fringe banks and other financial institutions, they are in a better position to attenuate the disruptive expansionary tendencies of our economy.”55
Minsky’s call to halt banking deregulation in general, to direct more sunshine at these institution’s lending practices, and to review and limit how much banks could loan out relative to their asset, debt, equity and cash reserves was as welcome in the Reagan years as a turd in the punchbowl on New Year’s Eve. Opportunity #3 to forestall the Great Recession got flushed down the shitter by late 1986.
The Dow Jones Industrial Average (DJIA) fell 500 points on “Black Monday” in October 1987. That may not sound like a big swing by today’s standards, but the Dow didn’t lose or gain 25% of its value on one day back then.56 Stock market volatility on that scale hadn’t been seen since World War II. Black Monday implied that America had entered choppy stock market waters. Why was that?
“Black Monday” analysis pointed to a potential culprit: derivative trading (futures and options trading).57 The Chicago Schooler Merton Miller played a key role in the development of derivative trading in the 1980s. He was ensconced at the University of Chicago’s GSB from the early 1960s through the early ‘90s, and served as a director at the Chicago Board of Trade, a leading futures and options exchange, in the mid-1980s.58
Miller was proud of his baby and was sure it would do great things. He wrote in 1994 that derivatives have “allowed firms and banks, at long last, to manage effectively and at low cost business and financial risks that have plagued them for decades.”59 Aww, doesn’t that make you wanna pinch those chubby little derivative cheeks?
Miller’s critics countered that derivatives enabled people and firms to bet on the bets of others, and so could supersize the type of speculative bubble that Minsky had warned about. Miller stayed as cool as a cucumber. He acknowledged the “fear that a failure by one big bank will bring down another bank which will bring down another until the world’s whole financial system melts down in some cataclysmic Chernobyl. That can happen of course, but it’s most unlikely.”60 With the steady hand of Alan Greenspan at the helm of the U.S.S. Federal Reserve, he maintained, America was in safe waters. Such a systemwide meltdown, Miller added, “are policy disasters, tracing not to transactions between private-sector parties but to deliberately deflationary actions of a central bank somewhere”, and the U.S. had its bases covered with Greenspan’s Fed.61
That’s one tall glass of Chicago School Kool Aid. Miller pre-blamed governments for future financial system meltdowns – and pre-whitewashed private lenders’ and derivative traders’ hands at the same time – by alleging any such disaster would be de facto proof that a country’s central bank hadn’t imbibed enough Chicago School Kool Aid in the first place. Thanks to Milton Friedman, Miller was saying, America had gleaned a hidden lesson from the Great Depression. The Fed of the 1990s was ready, willing and able to prevent financial system cataclysms. “Our own Federal Reserve System failed miserably on that count in the early 1930s, but at least learned some important lessons in the process that have made the prospect of a recurrence of the 1930s for the U.S. virtually unthinkable.”62
A dozen years after Miller wrote those words, America’s financial system was on the verge of pulling a full-blown Chernobyl, and the Chicago School-y Fed wasn’t up to the task of putting its derivative-irradiated genie back in the bottle. #ItsMillerTime.
♦
Orange County, California filed for bankruptcy in 1994 because one person, the county treasurer, made big, bad bets on derivates.63 Barings Bank, one of Britain’s oldest merchant banks, failed the next year because a single 28-year-old trader in Singapore held on to big, bad futures bets too long.64
Any navel gazing that occurred on the part of financial orgs and regulators following these red flag train wrecks yielded little or no tangible checks on derivative uses. It was full steam ahead, and lifted rug, meet broom.
A key rationale for engaging in derivative trades is that the Black-Scholes equation, which is at the heart of the derivative rationale, opens up new risk mitigation territory if the formula is properly applied. The exact same equation throws the door open to virtually unlimited speculation, too, when improperly applied.65 Guess which door America’s largest financial institutions sauntered through in the 1990s and 2000s? Credit default swaps took shape in the early ‘90s.66 Paging Dr. Minsky.
Myron Scholes, he of Black-Scholes equation fame, joined the board of the ironically named options trading house Long-Term Capital Management (LTCM) in 1994. The company made a pile of cash early on but then hit a brick wall in ’98.67 Let’s slow our roll and appreciate what happened here. One of the creators of the Black-Scholes equation helped run a business that stormed through door number two, partied hard for a few years, then tumbled off the third story balcony into a dumpster fire. The capper is that Miller himself was on LTCM’s board. If you tried to make this stuff up, no one would believe you.
LTCM had a debt-to-equity ratio of ~26:1 by early 1998 (it held equity of $4.7 billion but had borrowed $124.5 billion). What could go wrong? Oh, that’s right: interest rate swaps. Cleanup on aisle two, and bring extra paper towels because we have eggs splattered on faces across the tristate area. The Fed’s New York branch organized a $4.6 billion bailout involving LTCM’s largest creditors, which included a who’s who of Wall Street’s titans at the time; the goal of that fund was to prevent a potentially larger downward spiral of securities liquidation.68
LTCM was a Great Recession dry run. Not stopping the abuse of the Black-Scholes equation and not limiting the debt-to-equity ratios of derivative trading firms in the mid-1990s was the fourth missed opportunity to prevent the Great Recession.
The NYSE Composite index and the S&P 500 both tripled in value, roughly speaking, between 1970 and 1990. A lot of factors went into this growth: an increasing number of public companies; organic growth by public companies as a result of rising domestic and foreign demand; an influx of 401(k) plan and ESOP cash into these markets as companies shifted away from self-funded pension plans; a rise in derivative trading that gave investors a false sense of confidence in the market’s and the Fed’s risk mitigation chops; and rampant M&A among large players in the majority of large industries.
In 1998, for example, Citicorp and Travelers merged to form Citigroup, the world’s largest financial org, in deal worth $76 billion.
A range of U.S financial system indicators moved up dramatically in the 1980s and ‘90s. The Chicago School ideology, coupled with the tenacious, self-interested effort of hundreds, if not thousands of big businesses that internalized the #l-f-lib ideology between 1970 and 2000, did produce massive financial windfalls for most of the associated companies and their shareholders. That’s an unassailable fact.
My observation on top of this is simply that the Chicago Schoolers – from Miller, Friedman and Stigler on down – as well as many of their devotees in the corporate realm, falsely believed and argued that this gravy train could go on forever. They held this was a bottomless free lunch, not a sugar rush high or an extended meth-fueled bender. Many of these academics and corporate leaders deny to this day that more than offsetting socioeconomic downsides accrued as a result of their activities in the two decades prior to the Great Recession. That’s the period in which Hyman Minsky’s instability bomb went from blueprint to mass production, the fuse was lit, and America, collectively, failed to arrest that process. Chapter five will document the enormous socioeconomic downsides of allowing that bomb to be built and detonated.
James Glassman’s and Kevin Hassett’s Dow 36,000: The New Strategy for Profiting from the Coming Rise in the Stock Market hit the bookshelves in ’99. It was an epic pairing of true-blue AEI humdingers. The book sought to convince readers that stocks remained “cheap” and that if investors were “worried about missing the market’s big move upward, you will discover that it is not too late. Stocks are now in the midst of a one-time-only rise to much higher ground – to the neighborhood of 36,000 on the Dow Jones industrial average.”69
By sticking their fingers in the air, or perhaps elsewhere, Glassman and Hassett divined that America was about to be carried up, whole hog, into the neo aristocratic winner’s circle thanks to the mighty wings of our titans of industry. No systemic risks to been seen from the crow’s nest of the AEI.
The Glass-Steagall Act became a clearer ceiling on Wall Street firms’ growth plans in the 1990s. Citigroup’s CEO, Sandy Weill, wanted the firewall that separated commercial and investment banking dating back to the Great Depression taken down ASAP. Weill was a huge fan of 1999’s Financial Services Modernization Act that accomplished the task. Citigroup spent $100 million of the nearly $200 million that Wall Street companies spent lobbying lawmakers, and on related PR efforts, to get Glass-Steagall tossed onto the ash heap of history.70 For every member of Congress that voted against Glass-Steagall’s repeal (overwhelmingly Democrats), seven helped smash that firewall to rubble, and President Bill Clinton made the law’s demise official in November 1999.71
Weill then had a four-foot etching of himself made and engraved with the words, “The Shatterer of Glass–Steagall”, and he installed on his office wall.72 The champagne corks flew all over Wall Street. Glass-Steagall’s demise was the culmination of a multigenerational effort by the #unholyunion dream team: Chicago School academics, think tank pundits, PAC doners, lobbyists, Alan Greenspan’s Fed, and a concerted push by Wall Street’s top guns.73 It was the ultimate spiking of the football on the graves of Keynes, FDR, Bain, Brandeis and all of their fellow travelers over the first two-thirds of the 20th century.
Glass-Steagall’s demise wasn’t just a symbolic repudiation of the #progpop, New Deal and S-C-P eras; the repeal of those statutes allowed more speculation by Wall Street firms that would soon pay negative socioeconomic dividends in the form of the Great Recession.74 Allowing Glass-Steagall to fall by the wayside was missed opportunity #5 to forestall the worst recession in living memory of nearly all Americans.
♦
The #unholyunion rang in Y2K with a full head of steam. That year’s Commodity Futures Modernization Act ensured that over-the-counter derivatives remained unregulated, paving the way for their use in home loan financing. That’s when the trading of Credit Default Swaps (CDS’s) took off, and the trading of those instruments soon climbed into the trillions of dollars range a year.75
Brooksley Born, who had headed up the Commodity Futures Trading Commission (CFTC), warned that the explosive rise of unregulated derivatives could be systemically dangerous. Warren Buffet seconded her assessment and, in 2003, added that derivative traders were placing big bets on each other, a practice that he believed meant that “derivatives are financial weapons of mass destruction, carrying dangers that, while not latent, are potentially lethal.”76
Greenspan had zero time for such Minsky-ite worrywarts. The CFTC was barred from regulating derivatives just before Y2K, and Born soon resigned in protest.77 That how we do, fam.
The NYSE Composite index was in the 6,950 range and the S&P 500 was close to 1,300 at the end of the year 2000. Then so-called dot com crash happened. By the end of ’02, the NYSE Composite had slid to 5,000 and the S&P 500 had dipped to 900. Both these indices bounced back, but the corporate fraud that came to light in the dot com crash timeframe was another red flag that indicated, to those who cared to see it, that something was seriously wrong inside corporate America.
We touched on Enron’s implosion in late ’01 earlier, but it’s worth underscoring that its execs were top-notch book cookers in addition to price gougers. WorldCom, the nation’s second largest long-distance telephone company, imploded in mid-2002. The company later admitted that its execs had overstated assets by >$11 billion, and they’d inflated earnings in order to meet Wall Street’s expectations.78
WorldCom merged with MCI in a $37 billion deal in ’97, making it the largest corporate merger in U.S. history to that point. WorldCom thus made history twice in five years since its bankruptcy was also the largest in U.S. history to that point.79
Adelphia went belly up in ’02 as well. John and Timothy Rigas were later sentenced to 15 and 20 years in prison, respectively, for pilfering $2.3 billion from the cable TV company’s coffers.80 Adelphia made the dirty dozen list of America’s biggest bankruptcies at the time.
Then there was Global Crossing. The company had been a leading carrier and operator of networking services in the U.S. and was valued at $47 billion in 1999, making its ‘02 bankruptcy the fourth largest in history.81 That company broke accounting laws like they were going out of style.
These four cases of massive fraud and bankruptcy had much more to do with the fall of the NYSE and S&P 500 indices in 2001-2002 than anything Pets.com ever tried to sniff or leg hump. How is it possible nobody outside of these companies knew what was going on inside them until it was too late?
Lifted rug, meet broom. A fresh batch of “bad apples” comin’ atcha. The U.S. government’s failure to force and review thorough audits of the books of every public company coming out of the dot crash constitutes a sixth missed opportunity to forestall the Great Recession.
The Bush-Cheney administration, though, was busy not finding any weapons of mass destruction in Iraq, pounding the Taliban into dust with $100,000-dollar smart bombs, and getting the American Dream Downpayment Act over the finish line on the home front. That program offered up to $10,000 in federal assistance to low-income households who bought a new home. Mortgage lenders embraced the legislation like a long lost, wealthy uncle. By the end of the 2004, U.S. home ownership hit a record high of 69%, and nearly half of America’s minority households were livin’ the dream.82
The #unholyunion fired on all cylinders in 2005. Practically no one noticed or cared that James Glassman’s and Kevin Hassett’s Dow 36,000 prediction, that the DJIA would hit that mark in 2004, turned out to be ~4x too rosy.83 Can I interest you in a tall glass of pro-public corp Cheez Whiz?
Citigroup’s pro-plutonomy rock star trio of Ajay Kapur, Niall MacLeod, and Narendra Singh, with macho swagger, used their forearms to sprinkle sugar all over their “Plutonomy, Buying Luxury, Explaining Global Imbalances” creampuff that year.
Bankruptcy laws, meanwhile, began to bite with more force at the bottom of America’s socioeconomic pyramid thanks to the ever-vigilant eye of Chuck Grassley.84 Glad you had your finger on the pulse of America’s top internal stability threat, Chuck.
Wall Street’s nine TARP recipients-in-waiting split a lip-smacking $84.4 billion profit pie in 2005. The titans of private finance handed each other yachts like Tic Tacs. Key regulators, including Alan Greenspan, Hank Paulson, Ben Bernanke and Timothy Geithner, all sat firmly with their hands, beaming with pride as the Wall Street armada floated by. None of these people saw clouds in the sky. Greenspan loved him some derivatives in ’05; he reiterated industry self-regulation was more than up to the task of policing any market agent malfeasance.85
Under the surface, the undiagnosed leviathan of subprime mortgage loans, with “teaser” rates attached like razer-hooked tentacles, and supersized by derivative bets, was skyrocketing towards the surface and – wait, did we miss our tee time, fellas?86
Ben Bernanke was confirmed as Alan Greenspan’s successor at the Fed in 2006. The #unholyunion’s outgoing praise for Greenspan befitted one of St. Reagan’s last, great knights laying down his sword. Standard & Poor’s Financial Services, Moody’s Investors Service, and Fitch all stamped reams of subprime mortgage bonds with their highest rating, AAA, in his honor.
Standard & Poor’s signaled that it intended to tighten its subprime ratings model in mid-2006, inducing a curious response from Goldman Sachs and other financial titans that had been packaging these mortgages into bonds and selling them worldwide: these firms dumped an unusually large volume of subprime-riddled bonds into Standard & Poor’s approval pipeline just before its standard tightened.87 The teams at Goldman Sachs and comparable firms knew these instruments were up against Standard & Poor’s no-go line, if not over it. What was going into those AAA bond tins wasn’t caviar, of course, but a healthy scoop of dogshit sprinkled with enough caviar (non-subprime home loans) to fool the rating agency sniffers. AAA stamp applied. Next.
Standard & Poor’s and the other rating agencies were a critical piece of Greenspan’s and Bernanke’s alleged frontline, market-based defense against fraud in America’s financial markets. These agencies looked the other way circa 2006 because that business line was obscenely profitable.88 Greenspan’s faith in “self-regulation” was almost perfectly misplaced the day that he last walked out door of the Fed as chairman. The rating agencies’ shit detectors were so plugged with perfumed cash that any trace of dogshit wafting up from their bond tin QA factory line smelled like Atlas potpourri. AAA stamp applied. Next.
A few indie trading firms tried to deliver “self-regulatory” mortgage industry oversight circa 2006 and were stiff-armed by the financial titans who were engaged in the biggest case of fraud in world history. Two indie trading firms managed to pry open cans of Atlas brand caviar and take a whiff. Michael Lewis’ 2010 book (and 2015 movie), The Big Short, laid out the details in exquisite technicolor, so I won’t tread on Lewis’ hallowed ground here. Suffice to say that a key takeaway from his book is that, after a tragically, infuriatingly and incriminatingly long wait – during which Wall Street’s titans shifted from being the greatest purveyors of these shit-filled securities to betting against them – Scion Capital and Cornwall Capital made tens or hundreds of millions of dollars short-selling (betting against) U.S. subprime mortgage bonds.89
It took time for Scion’s Michael Burry and his traders to grasp that that Goldman Sachs’ and Morgan Stanley’s subprime “market” was no such thing because, at first, Scion’s traders were confused to see home mortgage default rates ticking up in late 2006, as Scion expected them to do, and then witness the company’s bets against those same bonds not paying off as expected. Month after month, the “market” refused to behave like a market, and, thanks to the big boys’ ironclad control over the feedback loop, the “market” kept holding two things to be true that couldn’t possibly be true at the same time.90
Cornwall Capital also discerned that Atlas caviar was shit-riddled in 2006. That’s the year that the no income, no job, no-asset (“ninja”) mortgage had its moment in the sun. Subprime lending rose to ~40% of all U.S. home mortgage lending in ’06.91 Cornwall’s senior analysts/traders couldn’t find a way to short-sell the associated securities. The firm wasn’t in the big boys’ club and found it nearly impossible to find a party that would take the other side of their bet.92
Arthur Laffer naturally gave the U.S. economy rave reviews in 2006.93 The Fed kept interest rates down from 2004 to 2006, despite significant growth in the economy and a rising tide of voices warning that the Fed’s approach might be fueling a speculative bubble.94 The Fed took a grand total of three enforcement actions against predatory lenders from 2003 to early 2007.95 That’s next level snooze button hitting. It makes the Bush-Cheney administration’s response to hurricane Katrina look relatively swift and robust.
Idaho’s Senator Crapo ushered the Financial Services Regulatory Relief Act through Congress in 2006. That legislation let banks hold even less cash in reserve; President Bush signed it into law in October.96
Pension law changes also went into effect that year, thanks to sponsors like Senator Roberts and Representative Boehner. A provision in that legislation forced a large share of pension plans to shift out of stable investments, such as money market funds, and into riskier stock portfolios – and another provision shielded employers from liability if those automated transfers wound up losing retirees and other investors piles of money. I wonder which slice of the #unholyunion pie benefitted from an automatic transfer of relatively safe pension plan monies into the much more volatile stock market?97
Citigroup’s Kapur, Macleod and Singh published “Revisiting Plutonomy: The Rich Getting Richer” in 2006. The rich are in “great shape”, these equity analyst savants observed, because they commanded 57% of America’s net worth, and because demand by middleclass and poor families had become incidental to the rise of plutocrats:98
Our thesis is that the rich are the dominant drivers of demand in many economies around the world (the US, UK, Canada and Australia)…Asset booms, a rising profit share and favorable treatment by market-friendly governments have allowed the rich to prosper and become a greater share of the economy in the plutonomy countries. Also, new media dissemination technologies like internet downloading, cable and satellite TV, have disproportionately increased their audiences, and hence gains to “superstars” – think golf, soccer, and baseball players, music/TV and move icons, fashion models, designers, celebrity chefs, etc. These “content” providers, the tech whizzes who own the pipes of distribution, the lawyers and bankers who intermediate globalization and productivity, the CEOs who lead the charge in converting globalization and technology to increase the profit share of the economy at the expense of labor, all contribute to plutonomy.
Kapur, Macleod and Singh may as well have spiked their creampuff on Galbraith’s grave. Apparently, the rich can buy great quantities of bread and do have the power to uplift all of society by dint of their brawny, gilt shoulders and shredded wings. Thank goodness “market-friendly” governments were allowing neo aristocrats to increase their socioeconomic power “at the expense of labor”. Citigroup’s rock star trio clearly believed that wealth accumulation was a zero-sum game – and by extension implied that trickle-down economics was as full of shit as Wall Street’s Atlas caviar tins. Which is it, #unholyunion? Does the wealth trickle down or not?
Let’s all slow our roll once more to draw a line to the obvious endpoint of the #trickledownfaithful vision. Did your net wealth Gini coefficient also move to one? Perfect inequality is their North Star, full stop.
Kapur, Macleod and Singh warned that stepped-up voting by people of limited means, a course reversal towards more business regulation, and higher corporate taxes could still threaten the plutocratic countries’ trip to the promised land, but they didn’t expect those changes to come anytime soon.99 Capitalists the world over should instead get ready to realize “an even greater share of the wealth pie over the next few years, as capitalists benefit disproportionately from globalization and the productivity boom, at the relative expense of labor. As we believe plutonomy explains away some of these conundrums…we are very relaxed about these issues.”100
Ah, yes. Relaxed and buzzed on Dow 36,000 plutonomy champagne. A few doors down, Kapur’s, Macleod’s and Singh’s colleagues were putting the finishing touches on their massive instability bomb. America’s #unholyunion zealots, including its regulatory captured members in the Bush-Cheney administration and in Congress, were grinning ear to ear as the subprime mortgage leviathan broke through the surface. Saying that they all wore rose-tinted glasses is an insult to Louis Vuitton. It’s more like they were looking through straws that had uncut rubies jammed in their far ends. A good look to be sure.
Milton Friedman succumbed a heart attack in 2006. He didn’t live to see all his well-laid chickens coming home to roost. What a life! Not long after his ashes were scattered on San Francisco Bay, however, a flock of Friedman-brand chickens appeared over the Golden Gate Bridge, each with stick of lit dyn-o-mite in its claws. The birds made beelines for every company holding subprime mortgage securities and related derivative bets.
New Century, a leading Californian subprime housing lender, was on the receiving end of the exploding chicken onslaught in April 2007. Its creditors, including Citigroup, Bank of America, and Morgan Stanley, were left holding the bag as New Century’s foreclosure rates climbed. The company’s two-year “teaser loans”, which had been signed in 2004, were now resetting at higher rates, and more and more homeowners couldn’t make their mortgage payments.
In August, a French investment bank, BNP Paribas, froze withdraws in a handful of funds heavily invested in the U.S. subprime securities. The bank observed that the “complete evaporation of liquidity in certain market segments of the U.S. securitization market has made it impossible to value certain assets fairly regardless of their quality or credit rating.”101 The broader appetite for U.S. subprime mortgage bonds soon fell off a cliff.102 Wall Street’s titans still had piles of these securities on their books, and more coming in their doors, when the game of musical chairs finally slowed to a crawl.
The U.S. economy flatlined in 4Q 2007. Few connected the dots to the sharp decline in new housing starts, but that pregnant pause turned out to be the quiet before the Great Recession shitstorm.103
References